> ## Documentation Index
> Fetch the complete documentation index at: https://docs.rocket.new/llms.txt
> Use this file to discover all available pages before exploring further.

# Analytics

> Monitor visits, bounce rate, traffic sources, and campaigns with Rocket.new built-in analytics - zero setup required.

export const LlmsDirective = () => <blockquote className="llms-directive">
    For the complete documentation index, see <a href="/llms.txt">llms.txt</a>.
    For a lightweight markdown version of this page, append .md to the URL.
  </blockquote>;

<LlmsDirective />

<Frame caption="Analytics dashboard overview">
  <iframe className="w-full aspect-video rounded-xl" src="https://www.youtube.com/embed/CoiIVllzSMo" title="Analytics dashboard overview" frameBorder="0" allow="accelerometer; autoplay; clipboard-write; encrypted-media; gyroscope; picture-in-picture" allowFullScreen />
</Frame>

Every deployed Rocket project includes a built-in analytics dashboard. No setup required. It starts collecting data as soon as your site is live.

## How to open analytics

<Steps>
  <Step title="Open your deployed task">
    Go to [rocket.new](https://rocket.new) and open the task you want to monitor. Make sure it has been launched, as analytics only tracks live traffic and the dashboard will be empty until your site is deployed.
  </Step>

  <Step title="Open Analytics">
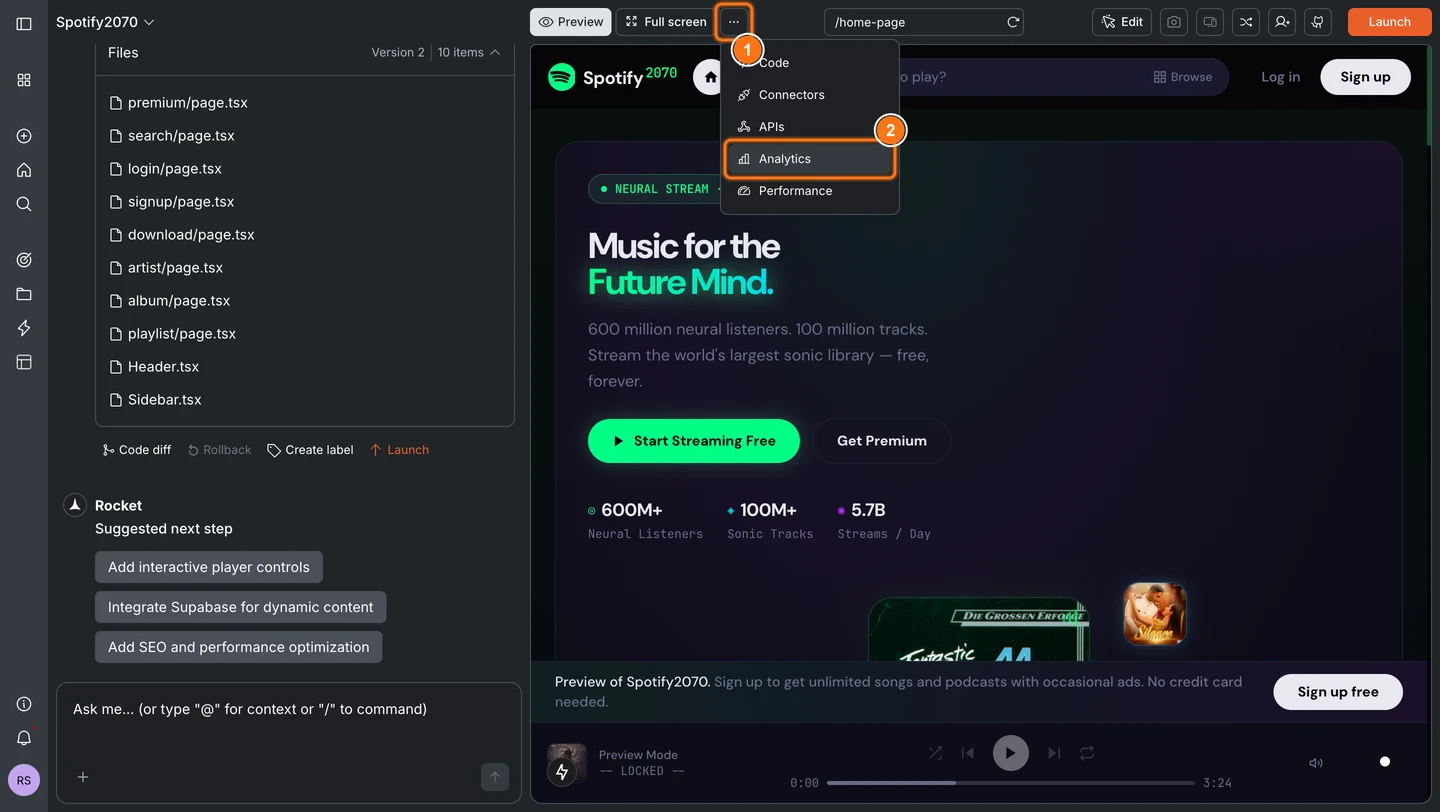
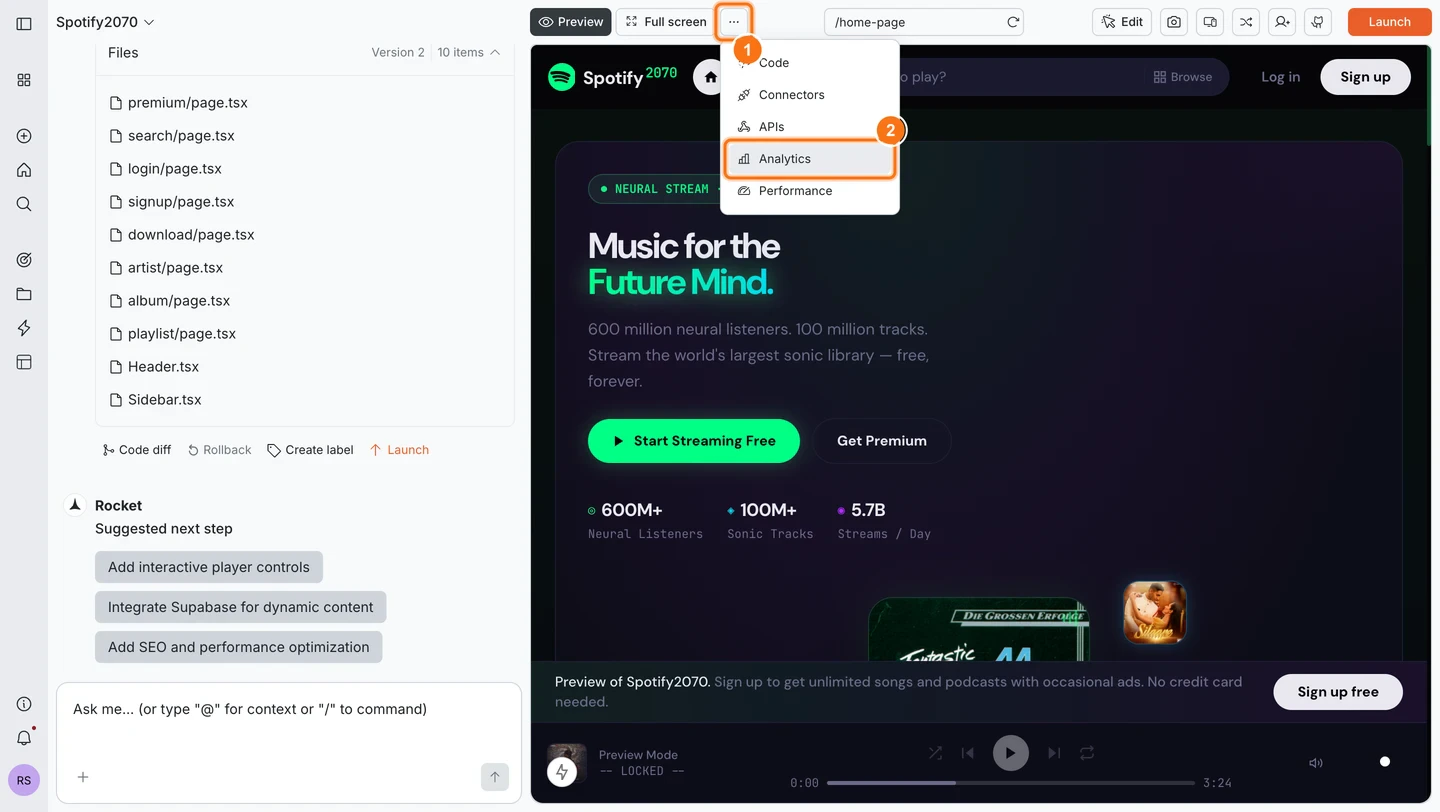
    Click **...** in the top navigation bar of your task, then select **Analytics** from the menu. The dashboard populates automatically as your site receives traffic.

    <Frame caption="Analytics dashboard">
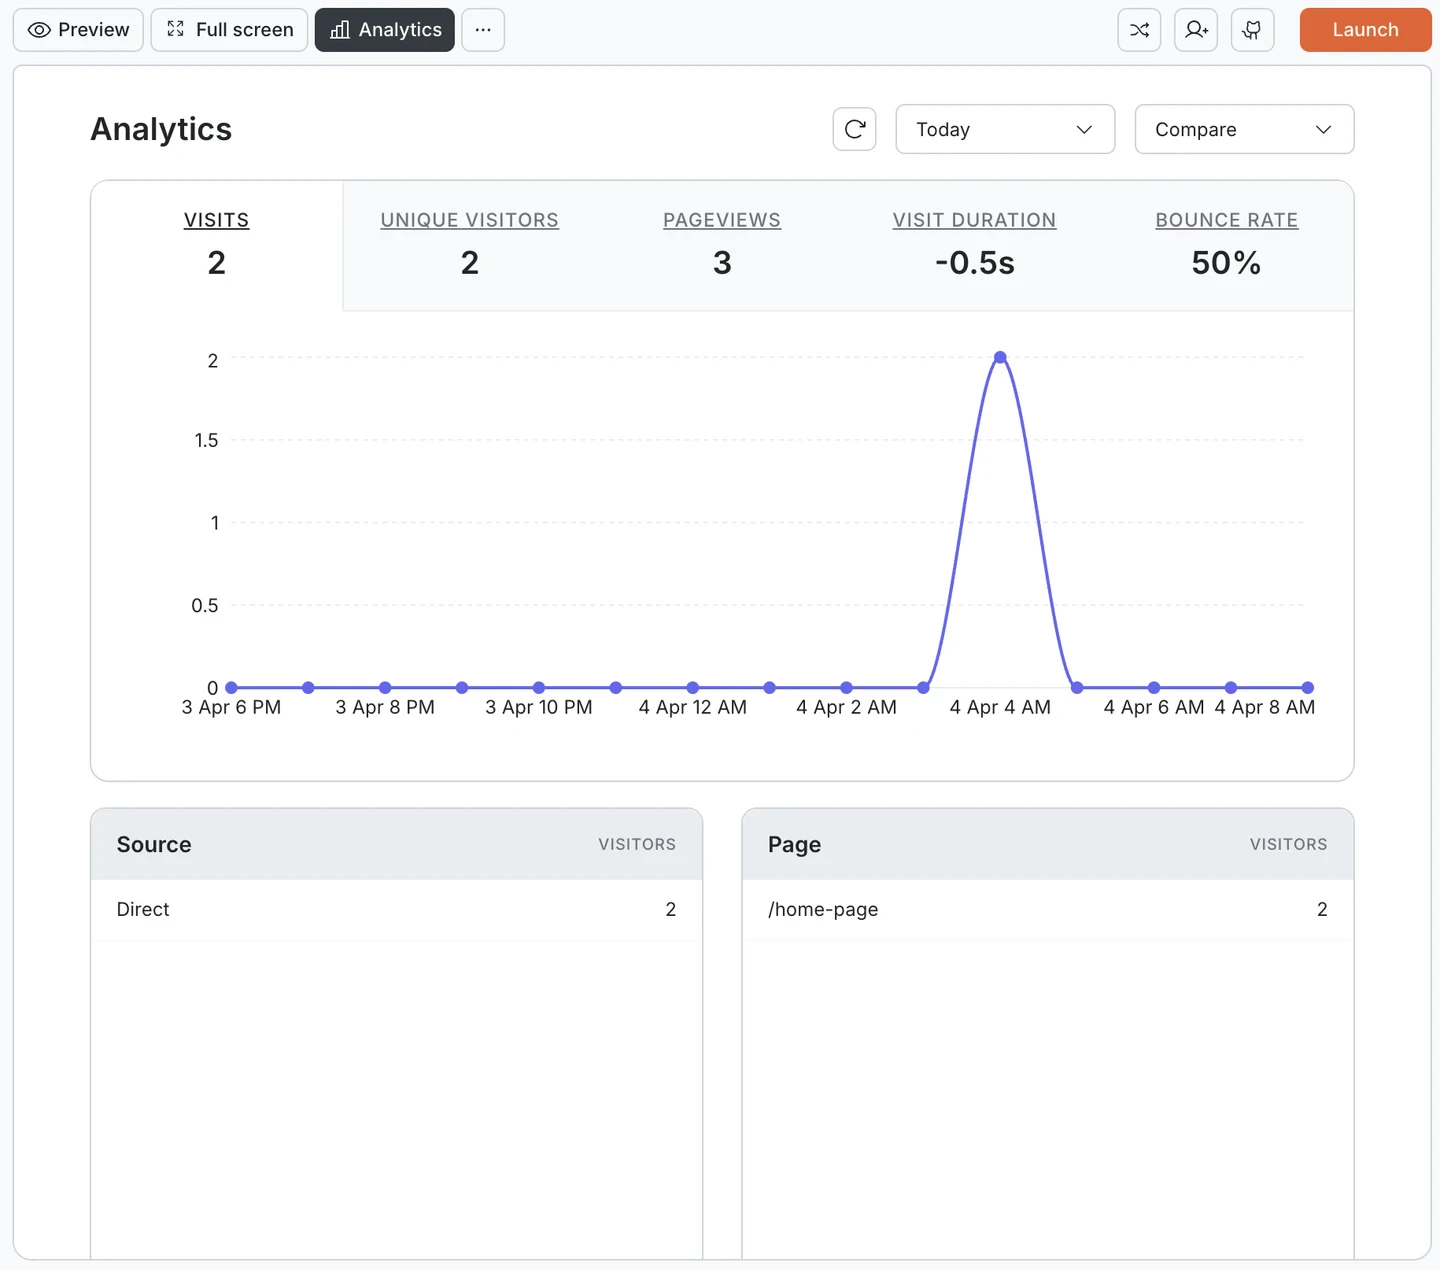
      <img src="https://mintcdn.com/dhiwisepvtltd-5e04e6a4/V8n5a5SD5I4rMm7t/images/build-docs/measure/analytics/web-browser/analytics-overview-light.webp?fit=max&auto=format&n=V8n5a5SD5I4rMm7t&q=85&s=201877cebda1da3ce910376d1d525c4c" alt="Analytics tab selected showing Visits, Unique Visitors, Pageviews, Visit Duration, Bounce Rate metrics and a visit timeline chart." className="theme-image light-image" width="1440" height="812" data-path="images/build-docs/measure/analytics/web-browser/analytics-overview-light.webp" />

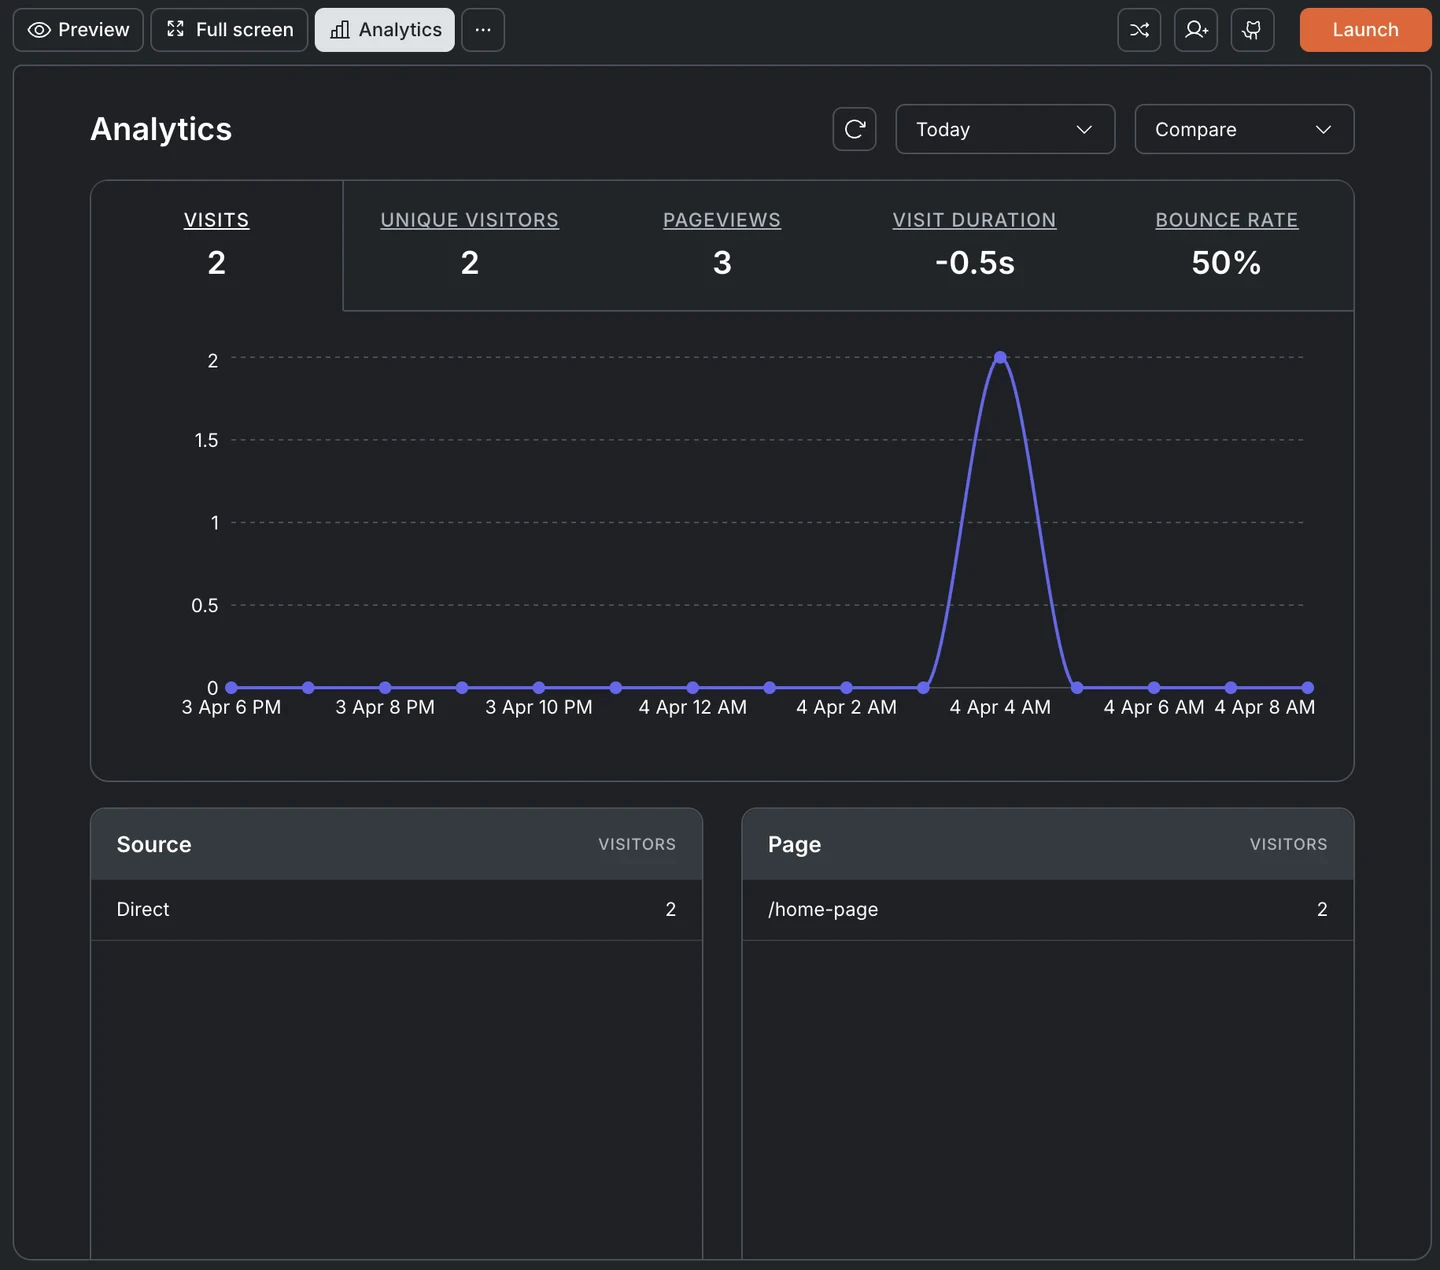
      <img src="https://mintcdn.com/dhiwisepvtltd-5e04e6a4/V8n5a5SD5I4rMm7t/images/build-docs/measure/analytics/web-browser/analytics-overview-dark.webp?fit=max&auto=format&n=V8n5a5SD5I4rMm7t&q=85&s=d1948ca1ac1a7bf927c23df95767078f" alt="Analytics tab selected showing Visits, Unique Visitors, Pageviews, Visit Duration, Bounce Rate metrics and a visit timeline chart." className="theme-image dark-image" width="1440" height="812" data-path="images/build-docs/measure/analytics/web-browser/analytics-overview-dark.webp" />
    </Frame>
  </Step>
</Steps>

<Note>
  Preview mode and localhost visits are not tracked. Only traffic to your deployed site is counted.
</Note>

## What the dashboard tracks

### Top-level metrics

Five metrics appear across the top of the dashboard:

| Metric              | What it measures                                             |
| ------------------- | ------------------------------------------------------------ |
| **Visits**          | Total number of sessions                                     |
| **Unique Visitors** | Distinct users who visited your site                         |
| **Pageviews**       | Total pages viewed across all sessions                       |
| **Visit Duration**  | Average time visitors spend on your site                     |
| **Bounce Rate**     | Percentage of visitors who leave after viewing a single page |

### Visits over time

A timeline chart plots visits over your selected date range. Hover over any point to see the exact count for that time slot.

Use the date filter to switch between **Today**, **7 days**, **30 days**, or a custom range. Use the **Compare** dropdown to compare traffic against another date.

### Traffic breakdowns

Five sections below the chart break down where your traffic is coming from and who is visiting:

| Section          | What it shows                                                                                                                     |
| ---------------- | --------------------------------------------------------------------------------------------------------------------------------- |
| **Source**       | Where visitors come from: direct, Google, social media, or referral links                                                         |
| **Page**         | Which pages get the most visits                                                                                                   |
| **Device**       | Desktop, mobile, or tablet split                                                                                                  |
| **Country**      | Geographic distribution of visitors                                                                                               |
| **UTM Campaign** | Traffic attributed to specific campaigns using UTM parameters. Append `?utm_campaign=name` to your shared URLs to start tracking. |

<Frame caption="Traffic breakdown tables">
  <img src="https://mintcdn.com/dhiwisepvtltd-5e04e6a4/V8n5a5SD5I4rMm7t/images/build-docs/measure/analytics/web-browser/analytics-full-view-light.webp?fit=max&auto=format&n=V8n5a5SD5I4rMm7t&q=85&s=4928ba39c9f537f2a296cfa3f79dd749" alt="Full analytics dashboard showing Source, Page, Device, Country, and UTM Campaign breakdown tables." className="theme-image light-image" width="1440" height="1270" data-path="images/build-docs/measure/analytics/web-browser/analytics-full-view-light.webp" />

  <img src="https://mintcdn.com/dhiwisepvtltd-5e04e6a4/V8n5a5SD5I4rMm7t/images/build-docs/measure/analytics/web-browser/analytics-full-view-dark.webp?fit=max&auto=format&n=V8n5a5SD5I4rMm7t&q=85&s=3e58f79b270f0083eadc6ca4e969906b" alt="Full analytics dashboard showing Source, Page, Device, Country, and UTM Campaign breakdown tables." className="theme-image dark-image" width="1440" height="1270" data-path="images/build-docs/measure/analytics/web-browser/analytics-full-view-dark.webp" />
</Frame>

<Divider />

## What's next?

<CardGroup cols={2}>
  <Card title="SEO & discoverability" icon="magnifying-glass" href="/build/polish/seo">
    Drive more organic traffic with better SEO settings.
  </Card>

  <Card title="Compliance & privacy" icon="shield-check" href="/build/polish/compliance">
    Cookie consent settings affect what analytics can track.
  </Card>

  <Card title="Performance" icon="gauge-high" href="/build/measure/performance">
    See how your site scores on Core Web Vitals and fix speed issues.
  </Card>

  <Card title="Custom code" icon="file-code" href="/build/editor/custom-code">
    Add third-party tracking scripts like Facebook Pixel or Hotjar.
  </Card>
</CardGroup>