> ## Documentation Index
> Fetch the complete documentation index at: https://docs.rocket.new/llms.txt
> Use this file to discover all available pages before exploring further.
# Performance
> Grade your Rocket.new site on Core Web Vitals and fix issues in one click with the built-in performance dashboard. Part of the only vibe solutioning platform with research, building, and intelligence.
export const LlmsDirective = () =>
For the complete documentation index, see llms.txt.
For a lightweight markdown version of this page, append .md to the URL.
;
Your site's speed affects who finds it, who stays, and who converts. Rocket measures your site on the same metrics Google uses, grades it from A to F, and shows you exactly what to fix.
Performance is only available for landing page and website projects. Google uses Core Web Vitals (LCP, INP, CLS) as a ranking signal. Sites that score poorly on these metrics risk lower placement in search results.
## Steps
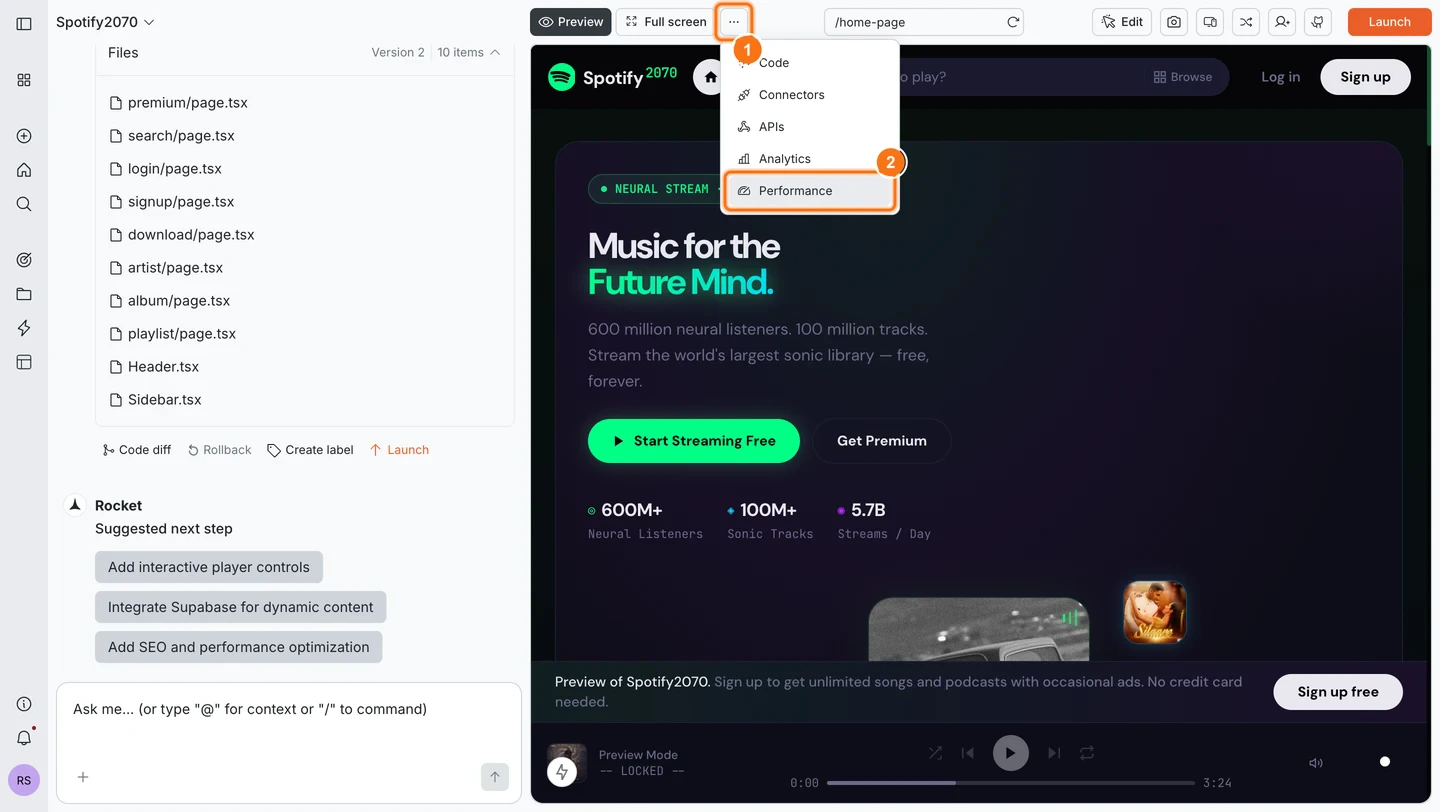
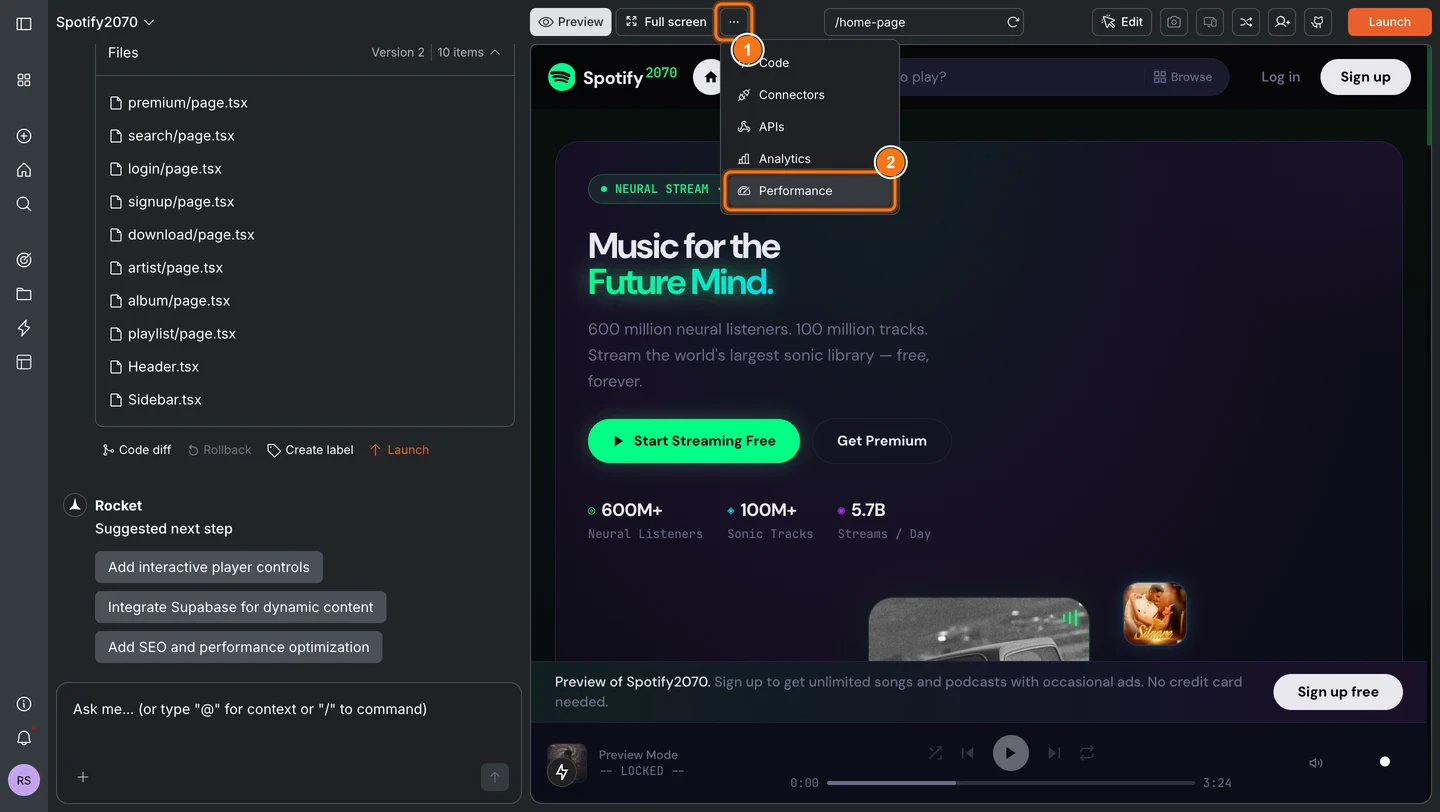
Click **...** in the top navigation bar of your task, then select **Performance** from the menu.
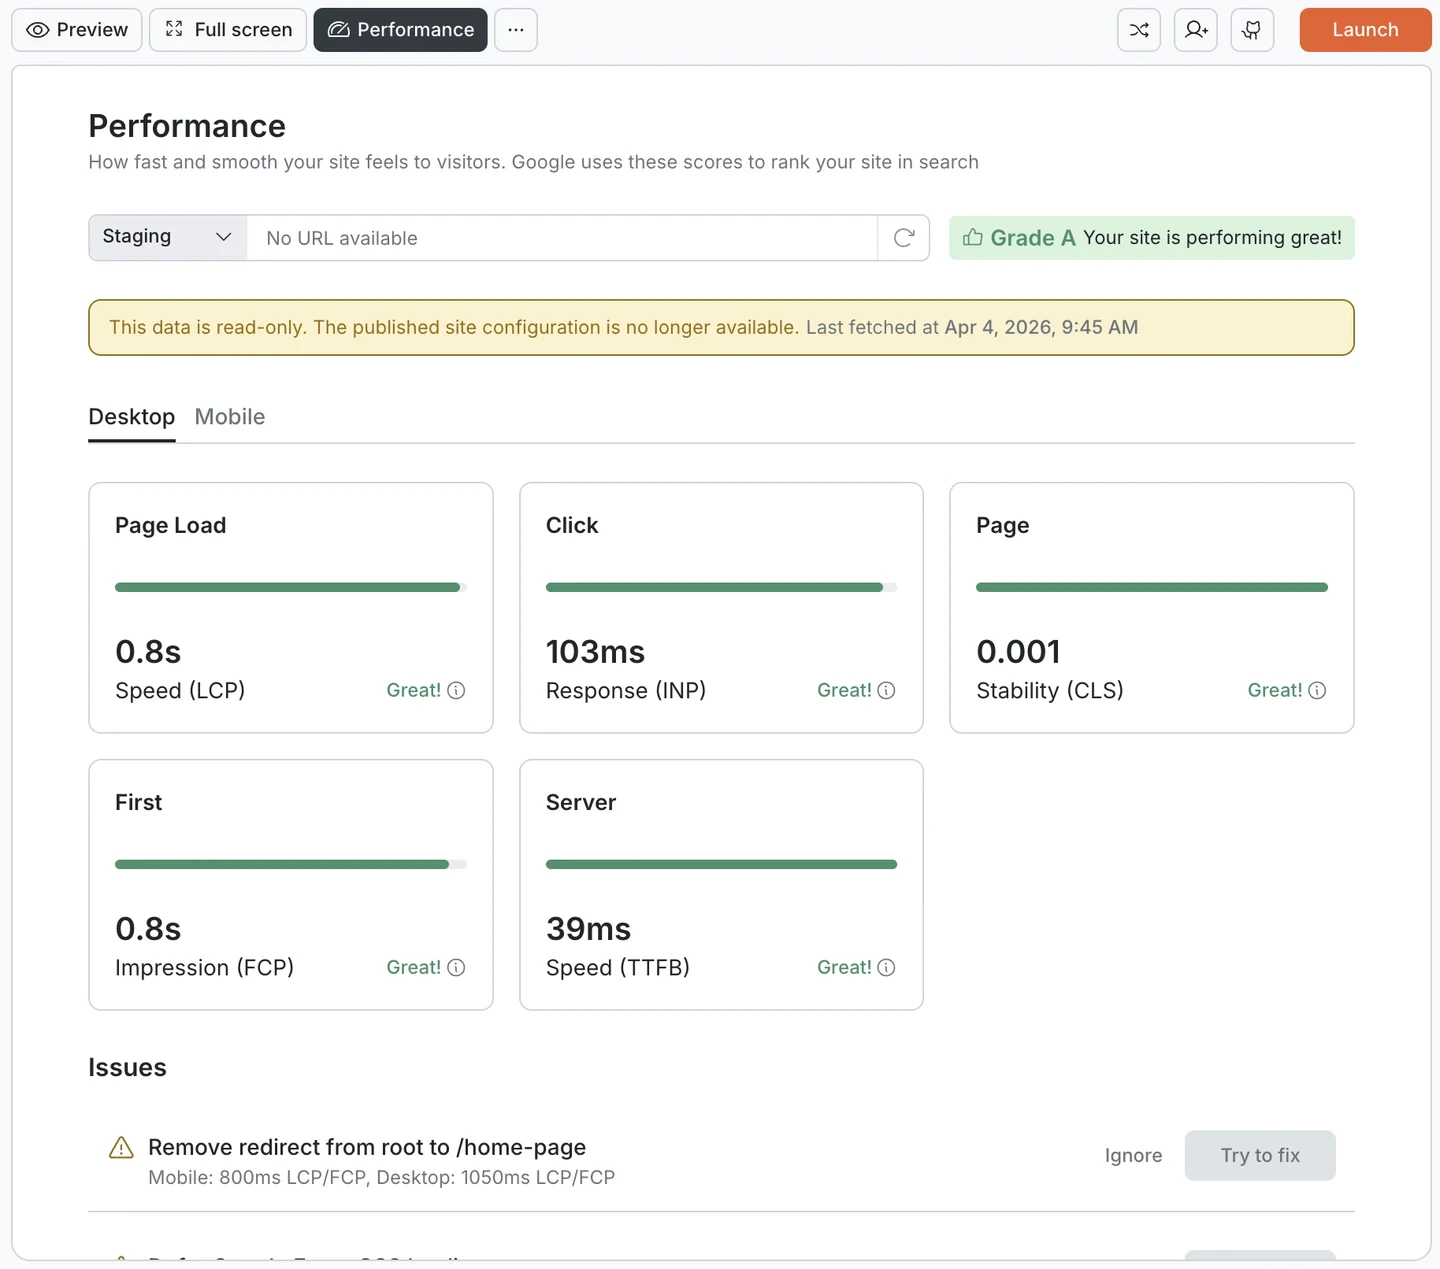
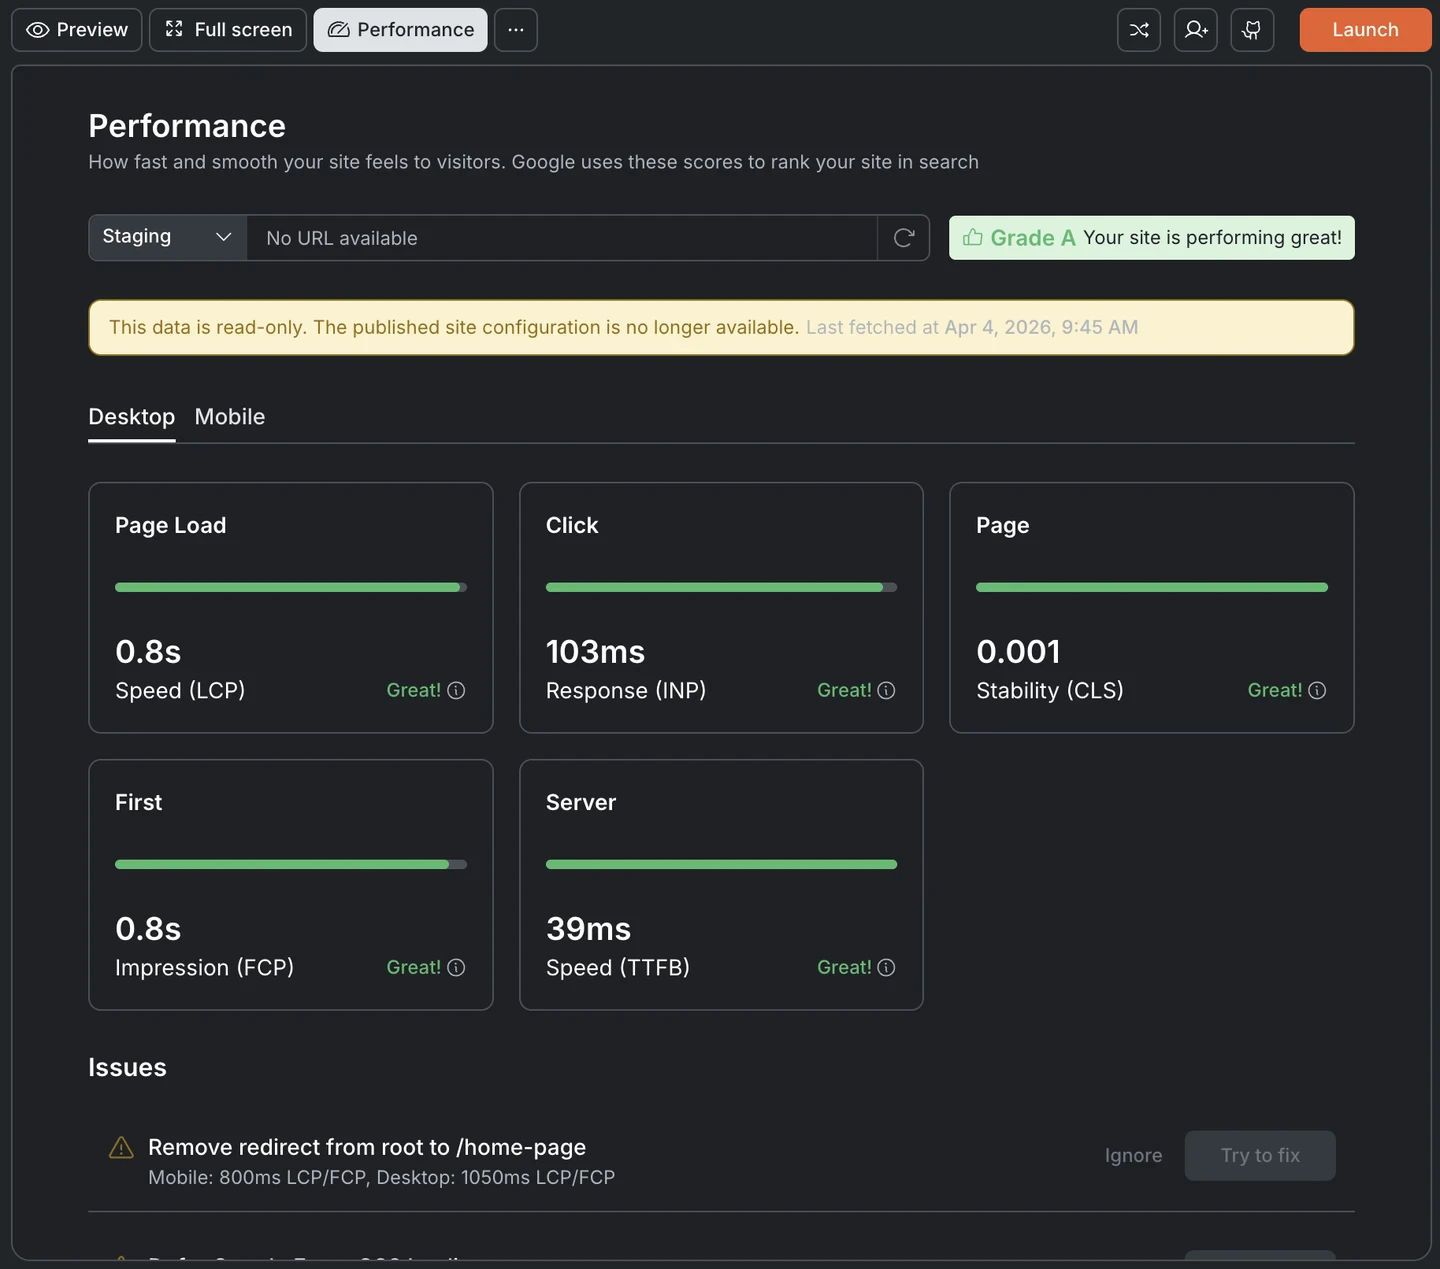
Use the **Staging / Production** toggle to choose which environment to check. Then switch between **Desktop** and **Mobile** to see scores for each.
Desktop and mobile scores are measured separately because page loading differs by device. Mobile connections are slower, screens are smaller, and browsers handle resources differently. A page that scores well on desktop can still perform poorly on mobile. Check both.
Click **Refresh** to fetch the latest scores.
In **Issues**, click **Try to fix** on items you want Rocket to resolve automatically.
**Try to fix** uses credits. Each fix is an AI-powered code change applied to your project.
Click **Refresh** again. Aim for consistent "Great" on LCP, INP, and CLS.
## What the dashboard measures
The Performance tab grades your site from **A to F** based on five metrics:
* **Three Core Web Vitals:** The metrics Google uses for search ranking.
* **Two diagnostics:** Supplementary metrics that help identify the root cause of slower scores.
Each metric shows a score, a progress bar, and a rating: Great, Needs Improvement, or Poor.
### Page load speed (LCP)
**Largest Contentful Paint** measures how long it takes for the main content of your page to become visible. This is usually the hero image, headline, or largest text block.
Visitors decide whether a page feels fast or slow based on this moment. Faster LCP means more people stay.
| Rating | Threshold |
| ----------------- | ----------------- |
| Great | Under 2.5 seconds |
| Needs Improvement | 2.5 to 4 seconds |
| Poor | Over 4 seconds |
### Click response (INP)
**Interaction to Next Paint** measures how quickly the page reacts when someone clicks, taps, or types. A slow INP makes the site feel unresponsive or broken even after it has fully loaded.
| Rating | Threshold |
| ----------------- | -------------- |
| Great | Under 200ms |
| Needs Improvement | 200ms to 500ms |
| Poor | Over 500ms |
### Page stability (CLS)
**Cumulative Layout Shift** measures how much the page layout moves while it is loading. A score of 0 means nothing shifts. Higher scores mean elements are jumping around, which causes misclicks and a frustrating experience.
| Rating | Threshold |
| ----------------- | ----------- |
| Great | Under 0.1 |
| Needs Improvement | 0.1 to 0.25 |
| Poor | Over 0.25 |
### First impression (FCP)
**First Contentful Paint** measures how quickly the first piece of content appears on screen, whether text, an image, or a background. Unlike LCP, which tracks the main content, FCP captures the first sign of life.
A fast FCP tells the visitor the page is working. A slow one looks like a blank screen.
| Rating | Threshold |
| ----------------- | ----------------- |
| Great | Under 1.8 seconds |
| Needs Improvement | 1.8 to 3 seconds |
| Poor | Over 3 seconds |
### Server speed (TTFB)
**Time to First Byte** measures how quickly the server starts sending a response to the browser. Everything else depends on this. If the server is slow, no amount of front-end optimization will make up for it.
| Rating | Threshold |
| ----------------- | --------------- |
| Great | Under 800ms |
| Needs Improvement | 800ms to 1800ms |
| Poor | Over 1800ms |
Thresholds are defined by [Google's Web Vitals standards](https://web.dev/articles/defining-core-web-vitals-thresholds) and measured at the 75th percentile of page views. This means if 75% of your visitors see a "Great" score, your site passes.
Staging scores reflect your current work in progress. Production scores reflect what real users experience on your live site. Check both before publishing to catch issues before they go live.
## Identified issues
Below the metric cards, Rocket lists specific issues detected on your site. Each issue includes the affected metric, the current value, and an estimated savings breakdown so you can see exactly where time or bytes are being lost.
Caused by unused JavaScript, render-blocking CSS, or unoptimized images.
Estimated waste in KiB shown for both mobile and desktop.
On generated images, affecting both LCP and FCP savings.
### Fixing or ignoring issues
Every issue has two actions:
* **Try to fix.** Rocket applies an automatic fix (compress images, remove unused code, add lazy loading, set cache headers). Each fix targets the exact metric that flagged the issue. This uses credits.
* **Ignore.** Dismisses the issue if it is not relevant or if you plan to address it manually.
## Improving your scores
You can also describe the issue to Rocket in chat and it will apply the fix for you.
```plaintext wrap Page speed theme={null}
Improve my site's page load speed. Optimize images, lazy load below-the-fold content, and reduce unused JavaScript.
```
```plaintext wrap Layout shifts theme={null}
Fix layout shift issues on my landing page. Make sure images and fonts have explicit dimensions so nothing jumps around while loading.
```
```plaintext wrap Server speed theme={null}
Improve server response time by adding caching headers and optimizing the critical rendering path.
```
## Frequently asked questions
Google uses Core Web Vitals as a ranking signal. Sites that fail the thresholds risk being pushed down in search results.
Beyond SEO, speed directly affects revenue: a [Deloitte study](https://www.deloitte.com/ie/en/services/consulting/research/milliseconds-make-millions.html) found that a 0.1-second speed improvement increased travel site conversions by 10.1%.
If you build sites for clients, a Grade A performance report is concrete proof of quality before they even review the design.
After every major change: adding images, new sections, third-party scripts, or fonts. Always before deploying to production. Rocket makes this a one-click task with the **Refresh** button.
Staging measures your work in progress inside Rocket. Production measures what real visitors experience on your [deployed site](/build/launch-web/launch-your-site). Scores can differ if your production environment has additional third-party scripts, different assets, or different server configurations.
Rocket analyzes the specific issue and applies targeted fixes: compressing oversized images, removing unused JavaScript, adding lazy loading to off-screen images, or setting proper cache headers. Each fix targets the exact metric that flagged the issue.
No. The **Try to fix** button handles everything automatically. You can also describe the issue in plain language in Rocket's chat and it will apply the changes.
LCP, INP, and CLS are the three Core Web Vitals that affect search ranking. FCP and TTFB are supplementary diagnostics. Rocket tracks all five because fixing TTFB or FCP often improves the core three as well.
## What's next?
Performance scores directly affect your Google search rankings. Optimize your site for search engines.
Track how performance improvements affect your traffic, bounce rate, and engagement over time.
Accessible sites tend to perform better due to cleaner HTML structure. Improve both at once.
Deploy to production so performance can be measured against real traffic.