> ## Documentation Index
> Fetch the complete documentation index at: https://docs.rocket.new/llms.txt
> Use this file to discover all available pages before exploring further.
# Reports
> Understand how Rocket.new Solve reports are structured and how to work with them after they generate.
export const LlmsDirective = () =>
For the complete documentation index, see llms.txt.
For a lightweight markdown version of this page, append .md to the URL.
;
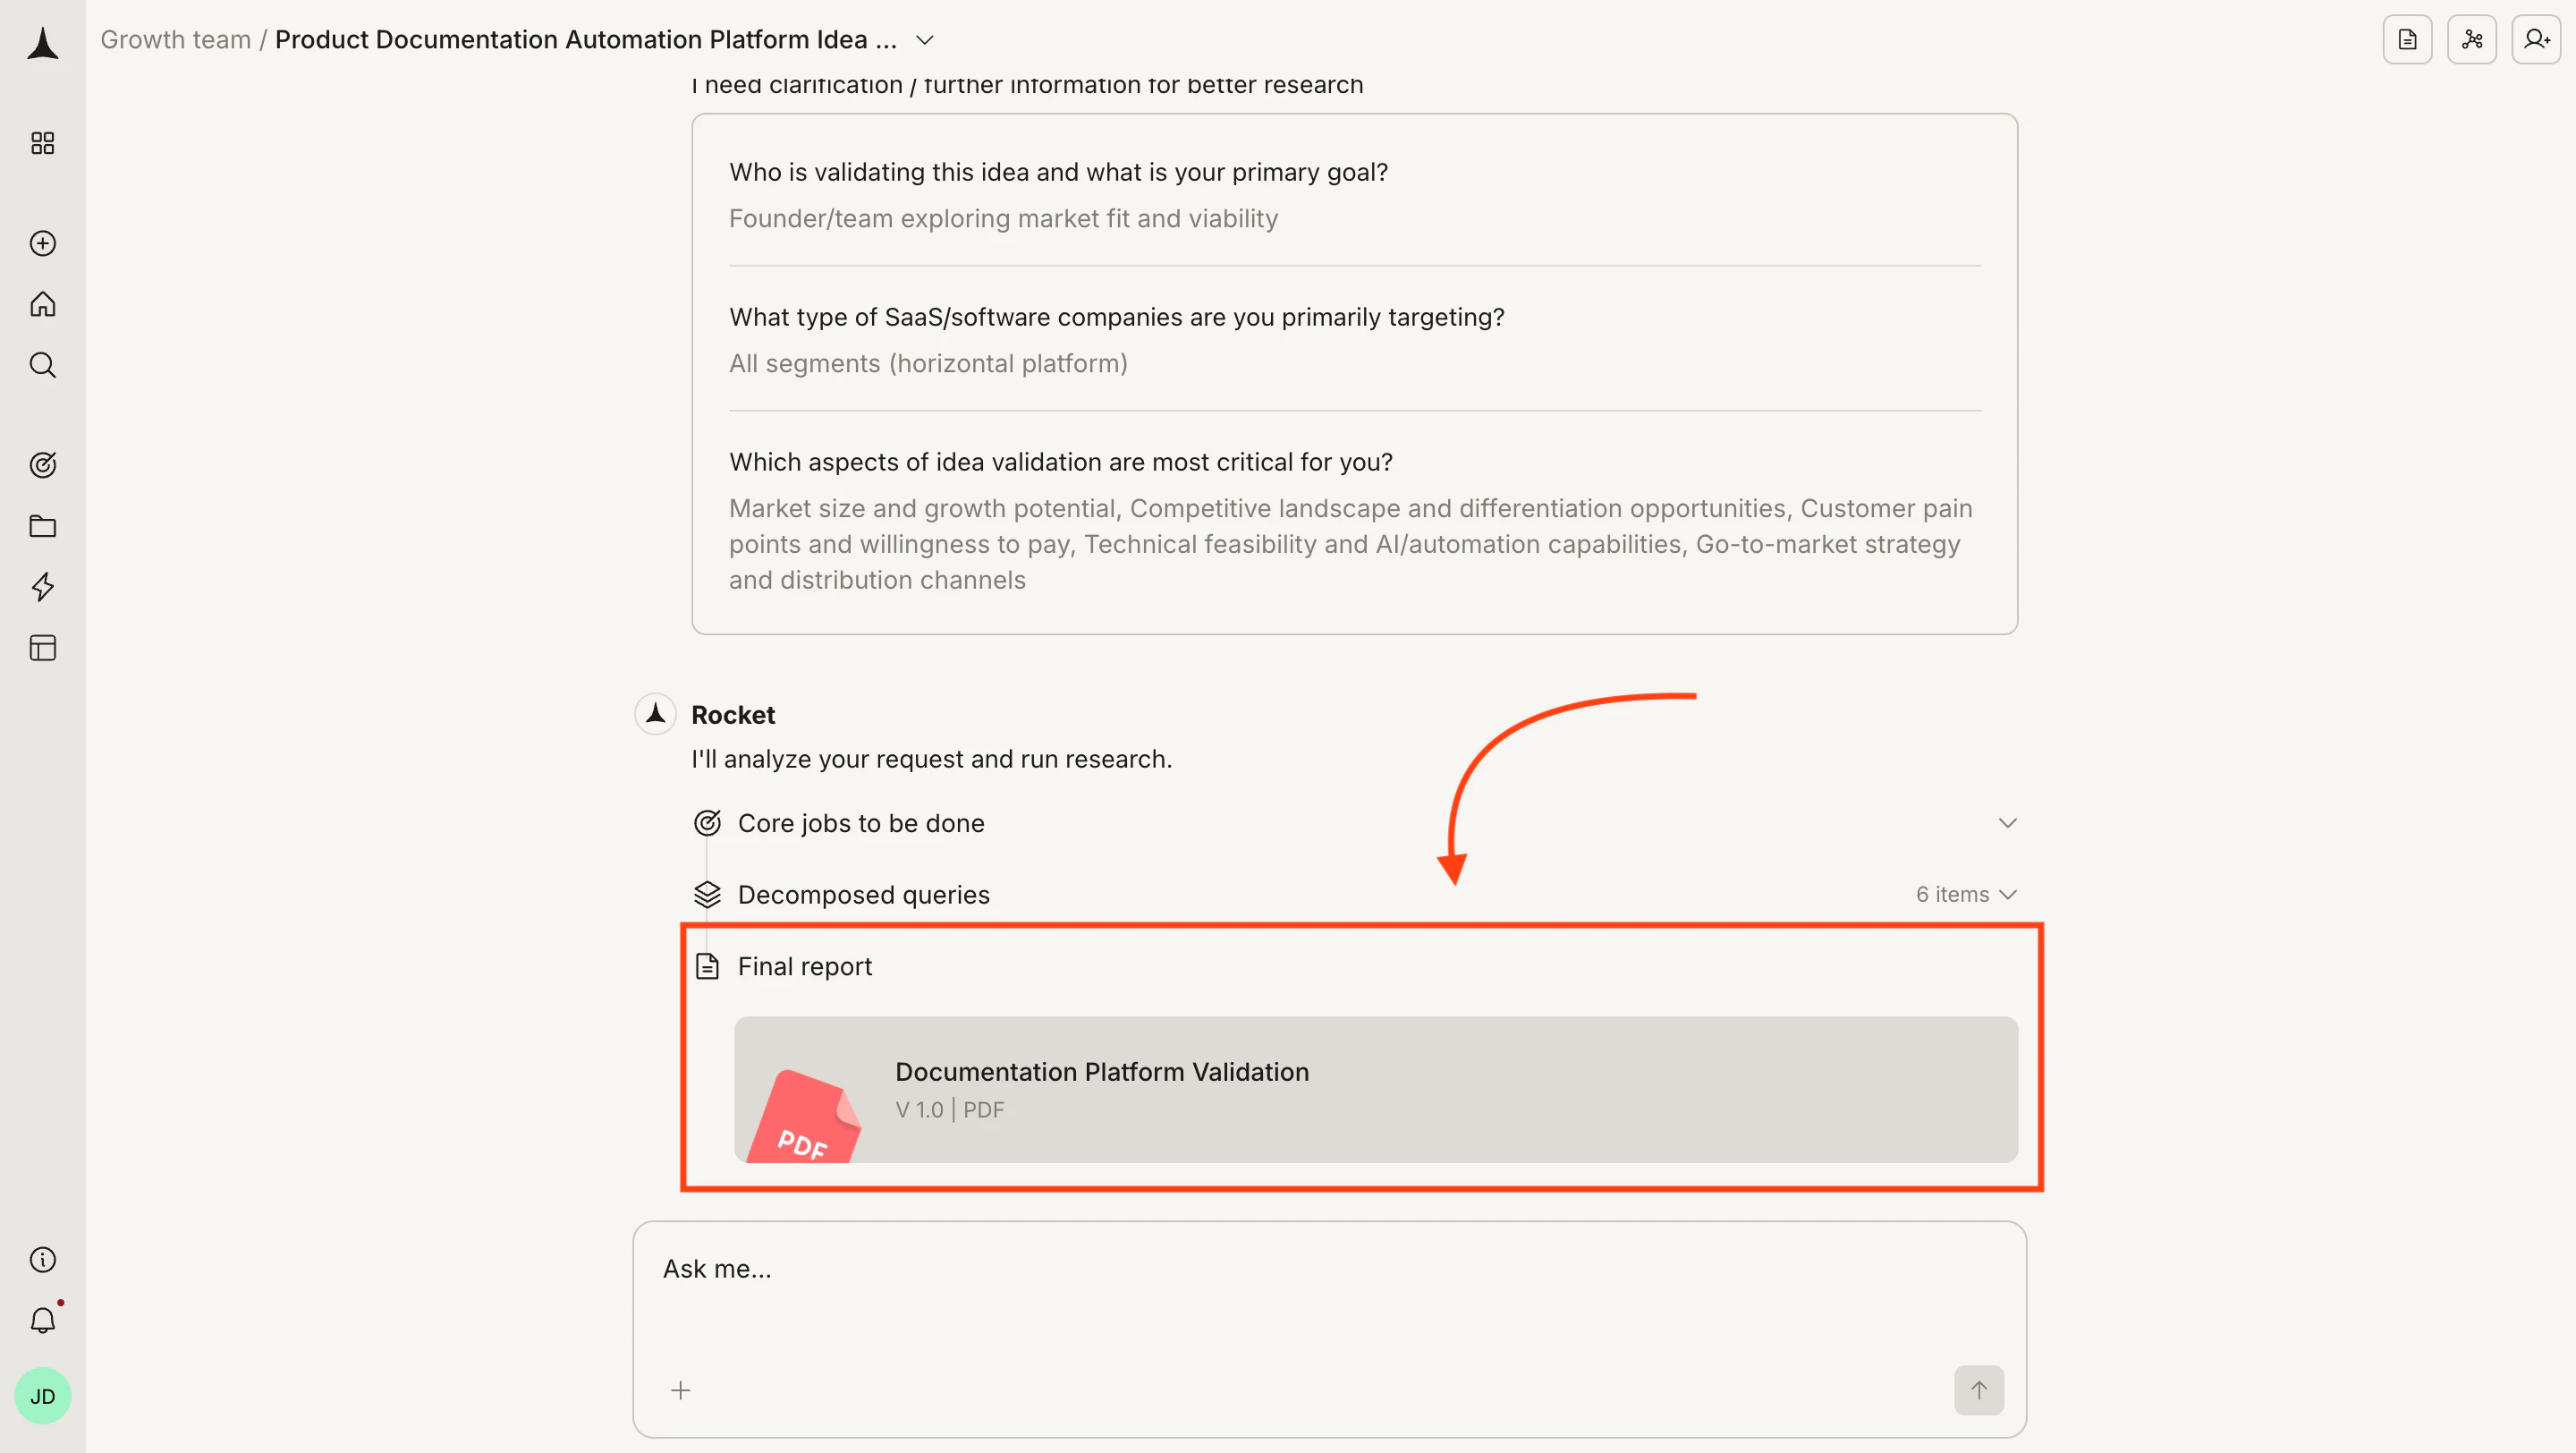
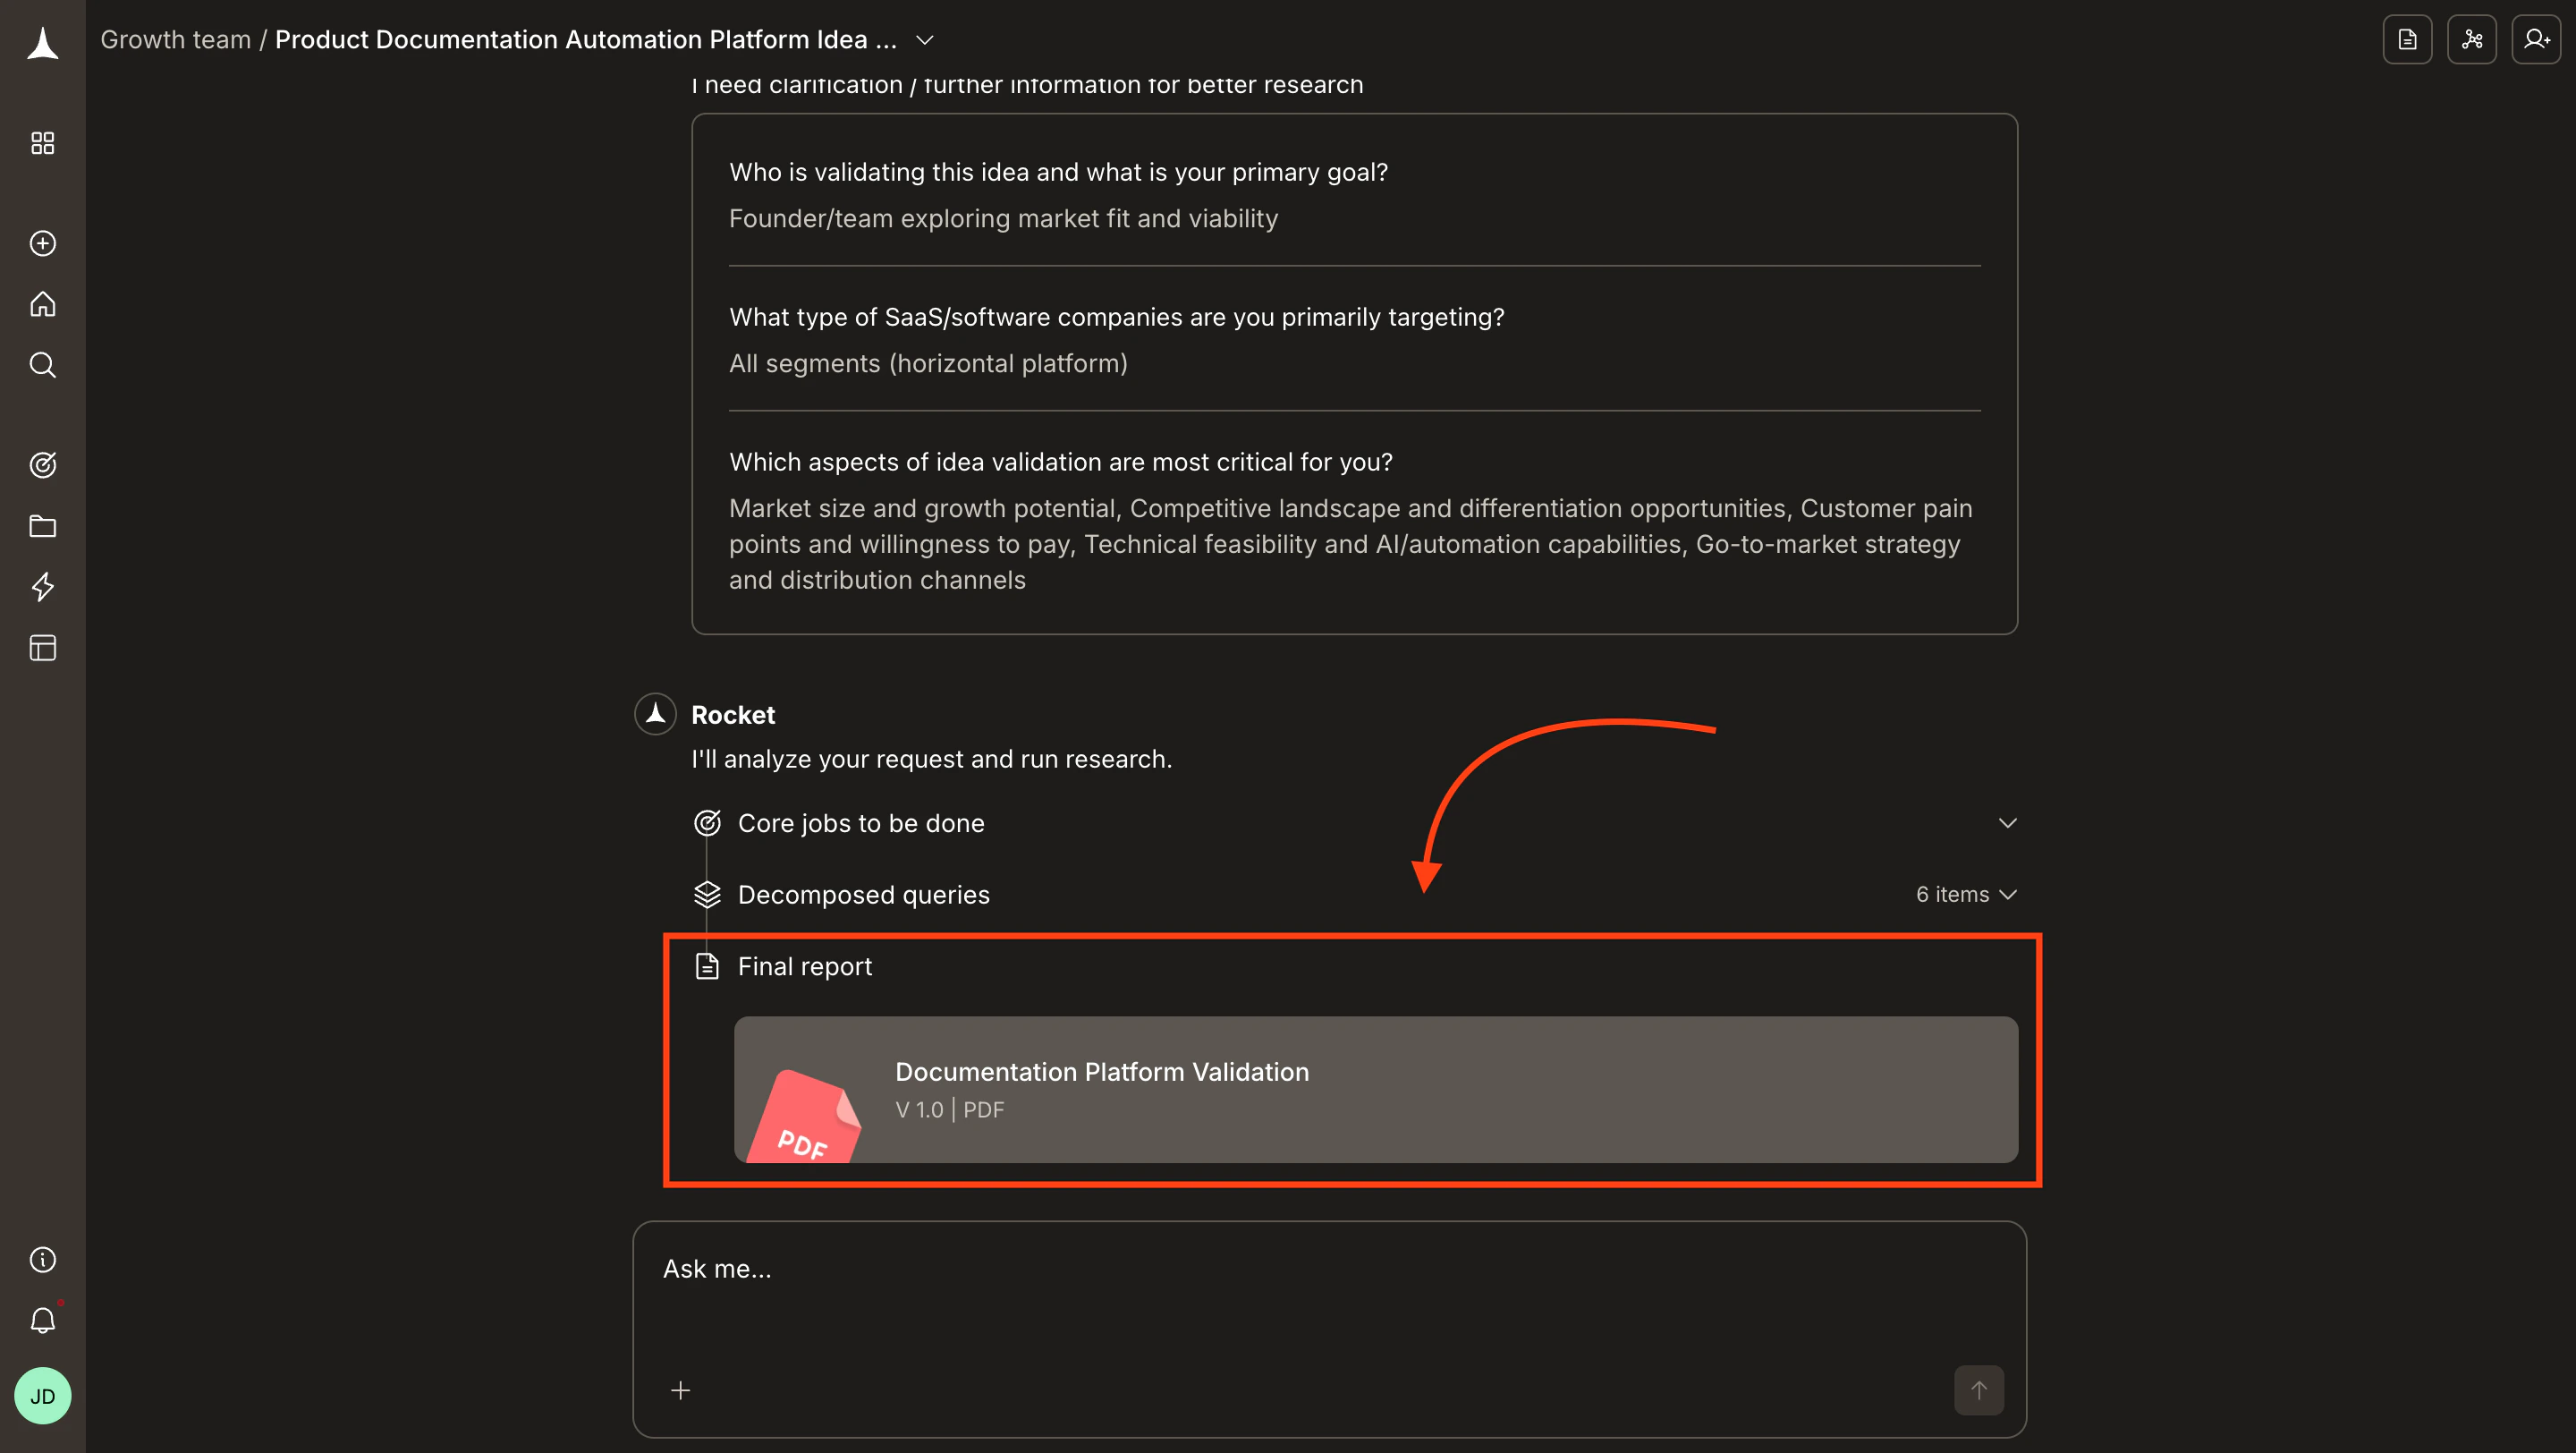
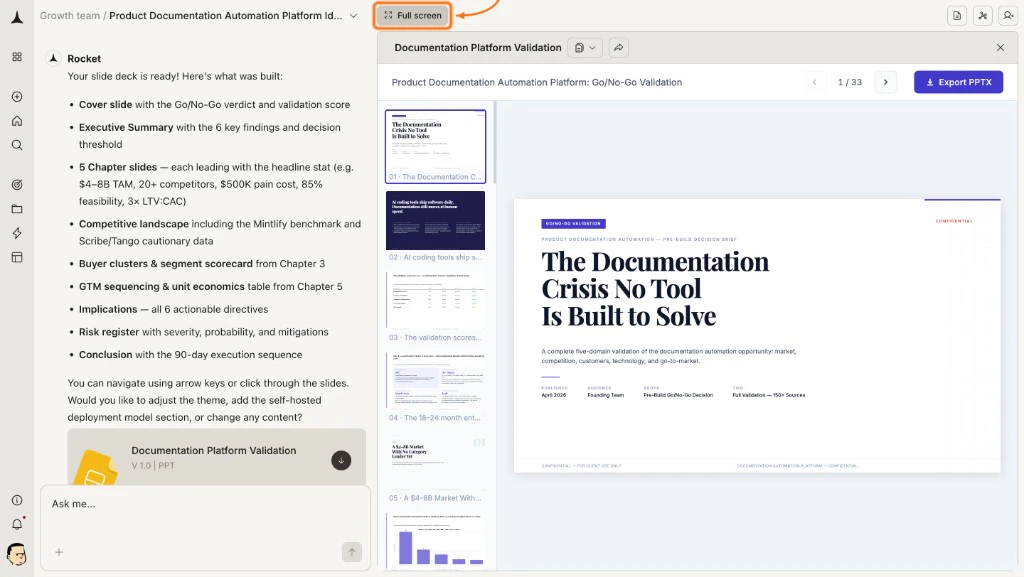
Solve delivers a structured report after every research task. A **Final report** link appears in the chat once research completes. Select it to open the report in the right-side panel while the chat stays on the left.
Solve reports draw on publicly available data and AI analysis. Always validate critical findings with primary research before using them in investor presentations, financial models, or major business decisions.
## Interface layout
The Solve workspace uses a split-panel design once a report is ready.
| Panel | What it shows |
| :----------------------- | :----------------------------------------------------------------------------------------------------------------------------------- |
| **Left panel (chat)** | Your conversation history, research streams, and follow-up messages. The Final report link and versioned document links appear here. |
| **Right panel (report)** | The rendered report with headings, tables, and recommendations. Stays visible while you continue chatting on the left. |
You can collapse the report panel to return to full-width chat, or expand it to full screen for focused reading.
## Report structure
Every Solve report follows a consistent five-part structure, regardless of question type.
| Section | What it contains |
| :-------------------------- | :-------------------------------------------------------------------------------------------------------------------------------------------------------------------------------------------- |
| **Executive summary** | Key findings in two to four sentences. Start here for a quick answer or to decide whether to read further. |
| **Detailed analysis** | The core of the report. Content varies by question type: market analyses include sizing tables, competitive teardowns include feature matrices, investment analyses include risk assessments. |
| **Supporting data** | Tables, comparisons, and data points backing up the analysis. Solve shows its work, including where numbers come from and what assumptions were made. |
| **Recommendations** | Actionable next steps based on the analysis. Specific rather than generic. |
| **Sources and methodology** | Where the data came from and how the analysis was structured. Use this to evaluate confidence before relying on findings for high-stakes decisions. |
 ## Toolbar
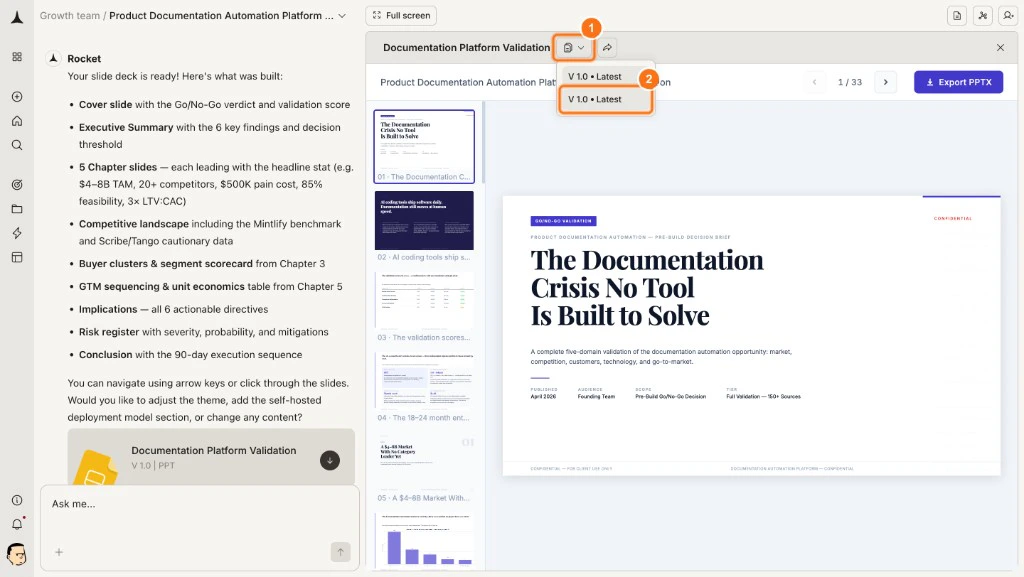
The report toolbar sits at the top of the report panel.
| Button | What it does |
| :------------------- | :------------------------------------------------------------------------------------------------------------------------ |
| **Version dropdown** | Shows the current version (e.g. V 1.0, Latest). Switch between all saved versions. Each edit cycle creates a new version. |
| **Share** | Generates a public link so anyone can view the report without a Rocket account. |
| **Full screen** | Expands the report to fill the screen. |
| **Documents** | Lists every report and file Rocket generated in this task. |
| **Attachments** | Lists all files you uploaded in this task. |
## Toolbar
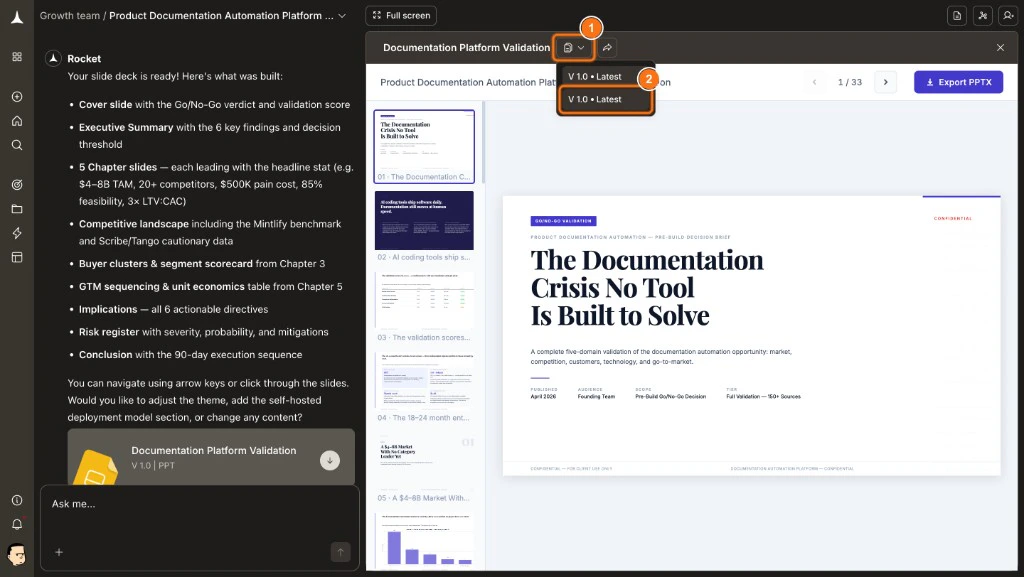
The report toolbar sits at the top of the report panel.
| Button | What it does |
| :------------------- | :------------------------------------------------------------------------------------------------------------------------ |
| **Version dropdown** | Shows the current version (e.g. V 1.0, Latest). Switch between all saved versions. Each edit cycle creates a new version. |
| **Share** | Generates a public link so anyone can view the report without a Rocket account. |
| **Full screen** | Expands the report to fill the screen. |
| **Documents** | Lists every report and file Rocket generated in this task. |
| **Attachments** | Lists all files you uploaded in this task. |
 Invite team members, assign roles, and collaborate on reports together.
## Report types
Different question types produce different report structures.
| Question type | Key sections | Typical length |
| :------------------------------------------------------------- | :---------------------------------------------- | :------------------- |
| [Market analysis](/solve/research/market-analysis) | Market sizing, growth drivers, landscape | 800 to 1,500 words |
| [Competitive teardowns](/solve/research/competitive-teardowns) | Feature matrix, SWOT, gap analysis | 1,000 to 2,000 words |
| [Pricing strategy](/solve/research/pricing-strategy) | Pricing tables, model analysis, recommendations | 600 to 1,200 words |
| [Product direction](/solve/research/product-direction) | Prioritization framework, evidence, tradeoffs | 800 to 1,500 words |
| [Investment analysis](/solve/research/investment-analysis) | Thesis, financials, risk matrix, recommendation | 1,000 to 2,000 words |
## What's next
Query, modify, and extend reports through conversation.
Generate a polished HTML page or PPT deck in one message.
Share via link, export as PDF, or copy content to other tools.
Invite team members, assign roles, and collaborate on reports together.
## Report types
Different question types produce different report structures.
| Question type | Key sections | Typical length |
| :------------------------------------------------------------- | :---------------------------------------------- | :------------------- |
| [Market analysis](/solve/research/market-analysis) | Market sizing, growth drivers, landscape | 800 to 1,500 words |
| [Competitive teardowns](/solve/research/competitive-teardowns) | Feature matrix, SWOT, gap analysis | 1,000 to 2,000 words |
| [Pricing strategy](/solve/research/pricing-strategy) | Pricing tables, model analysis, recommendations | 600 to 1,200 words |
| [Product direction](/solve/research/product-direction) | Prioritization framework, evidence, tradeoffs | 800 to 1,500 words |
| [Investment analysis](/solve/research/investment-analysis) | Thesis, financials, risk matrix, recommendation | 1,000 to 2,000 words |
## What's next
Query, modify, and extend reports through conversation.
Generate a polished HTML page or PPT deck in one message.
Share via link, export as PDF, or copy content to other tools.