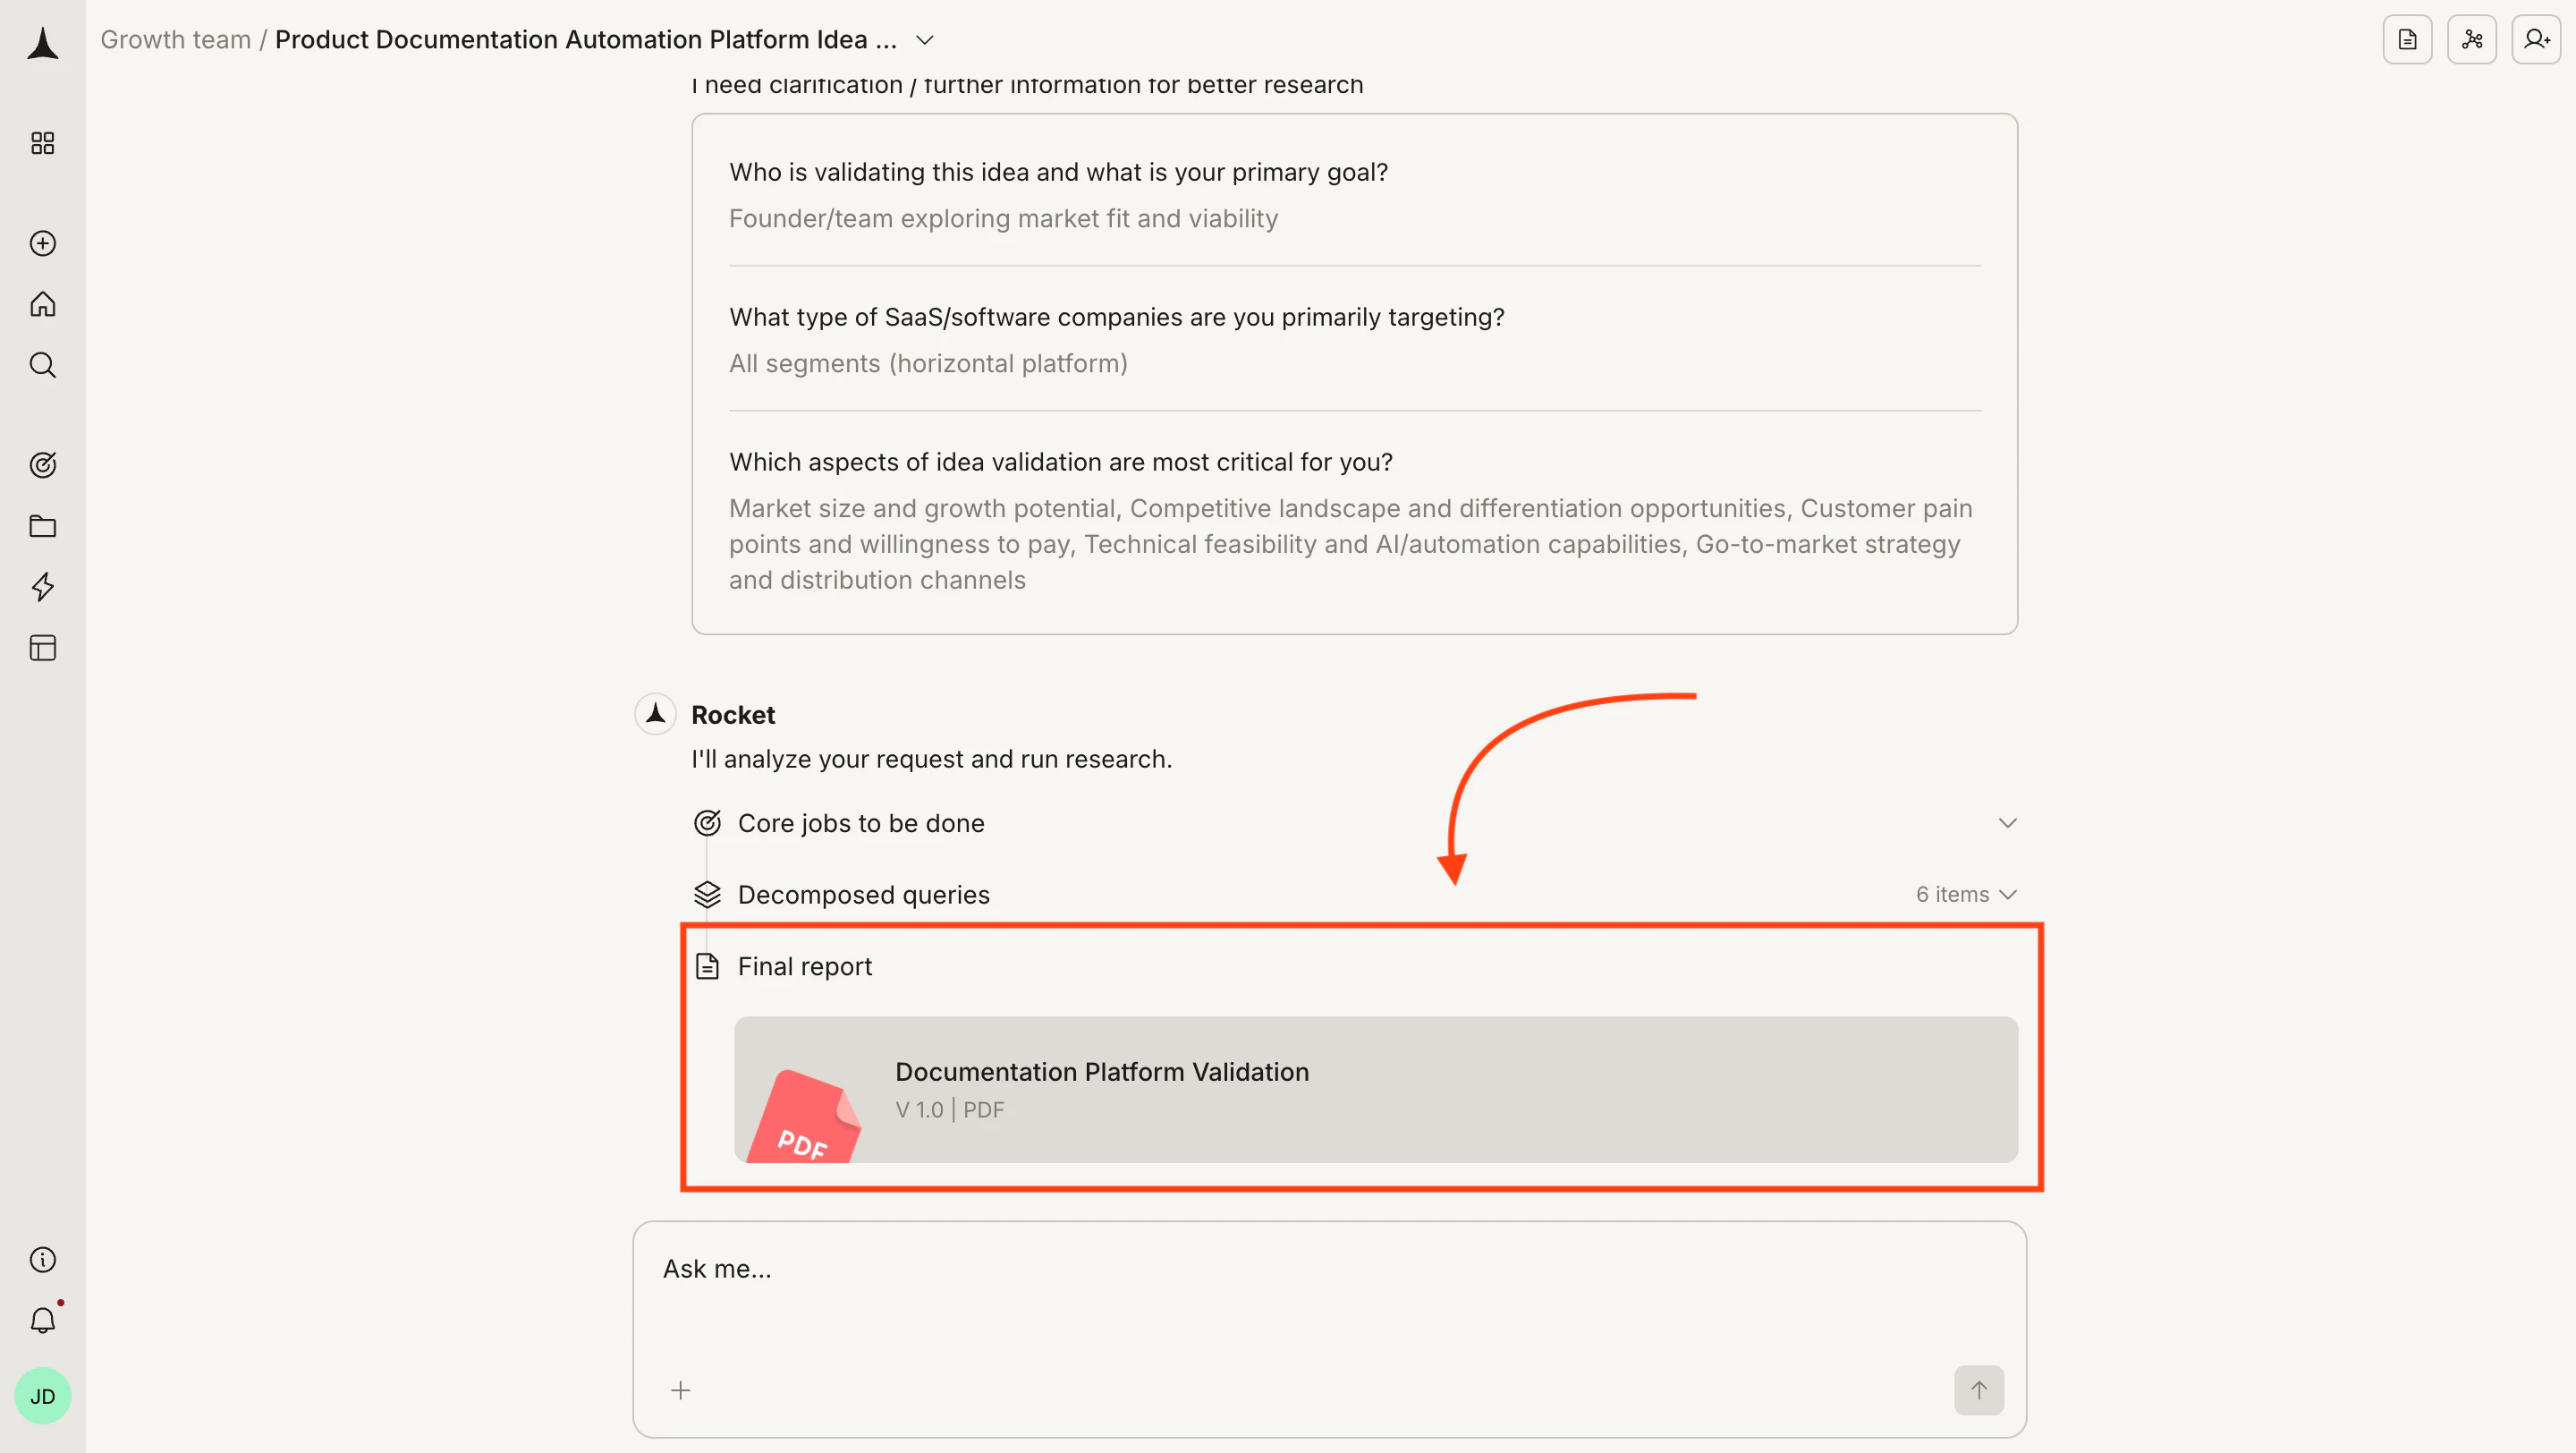
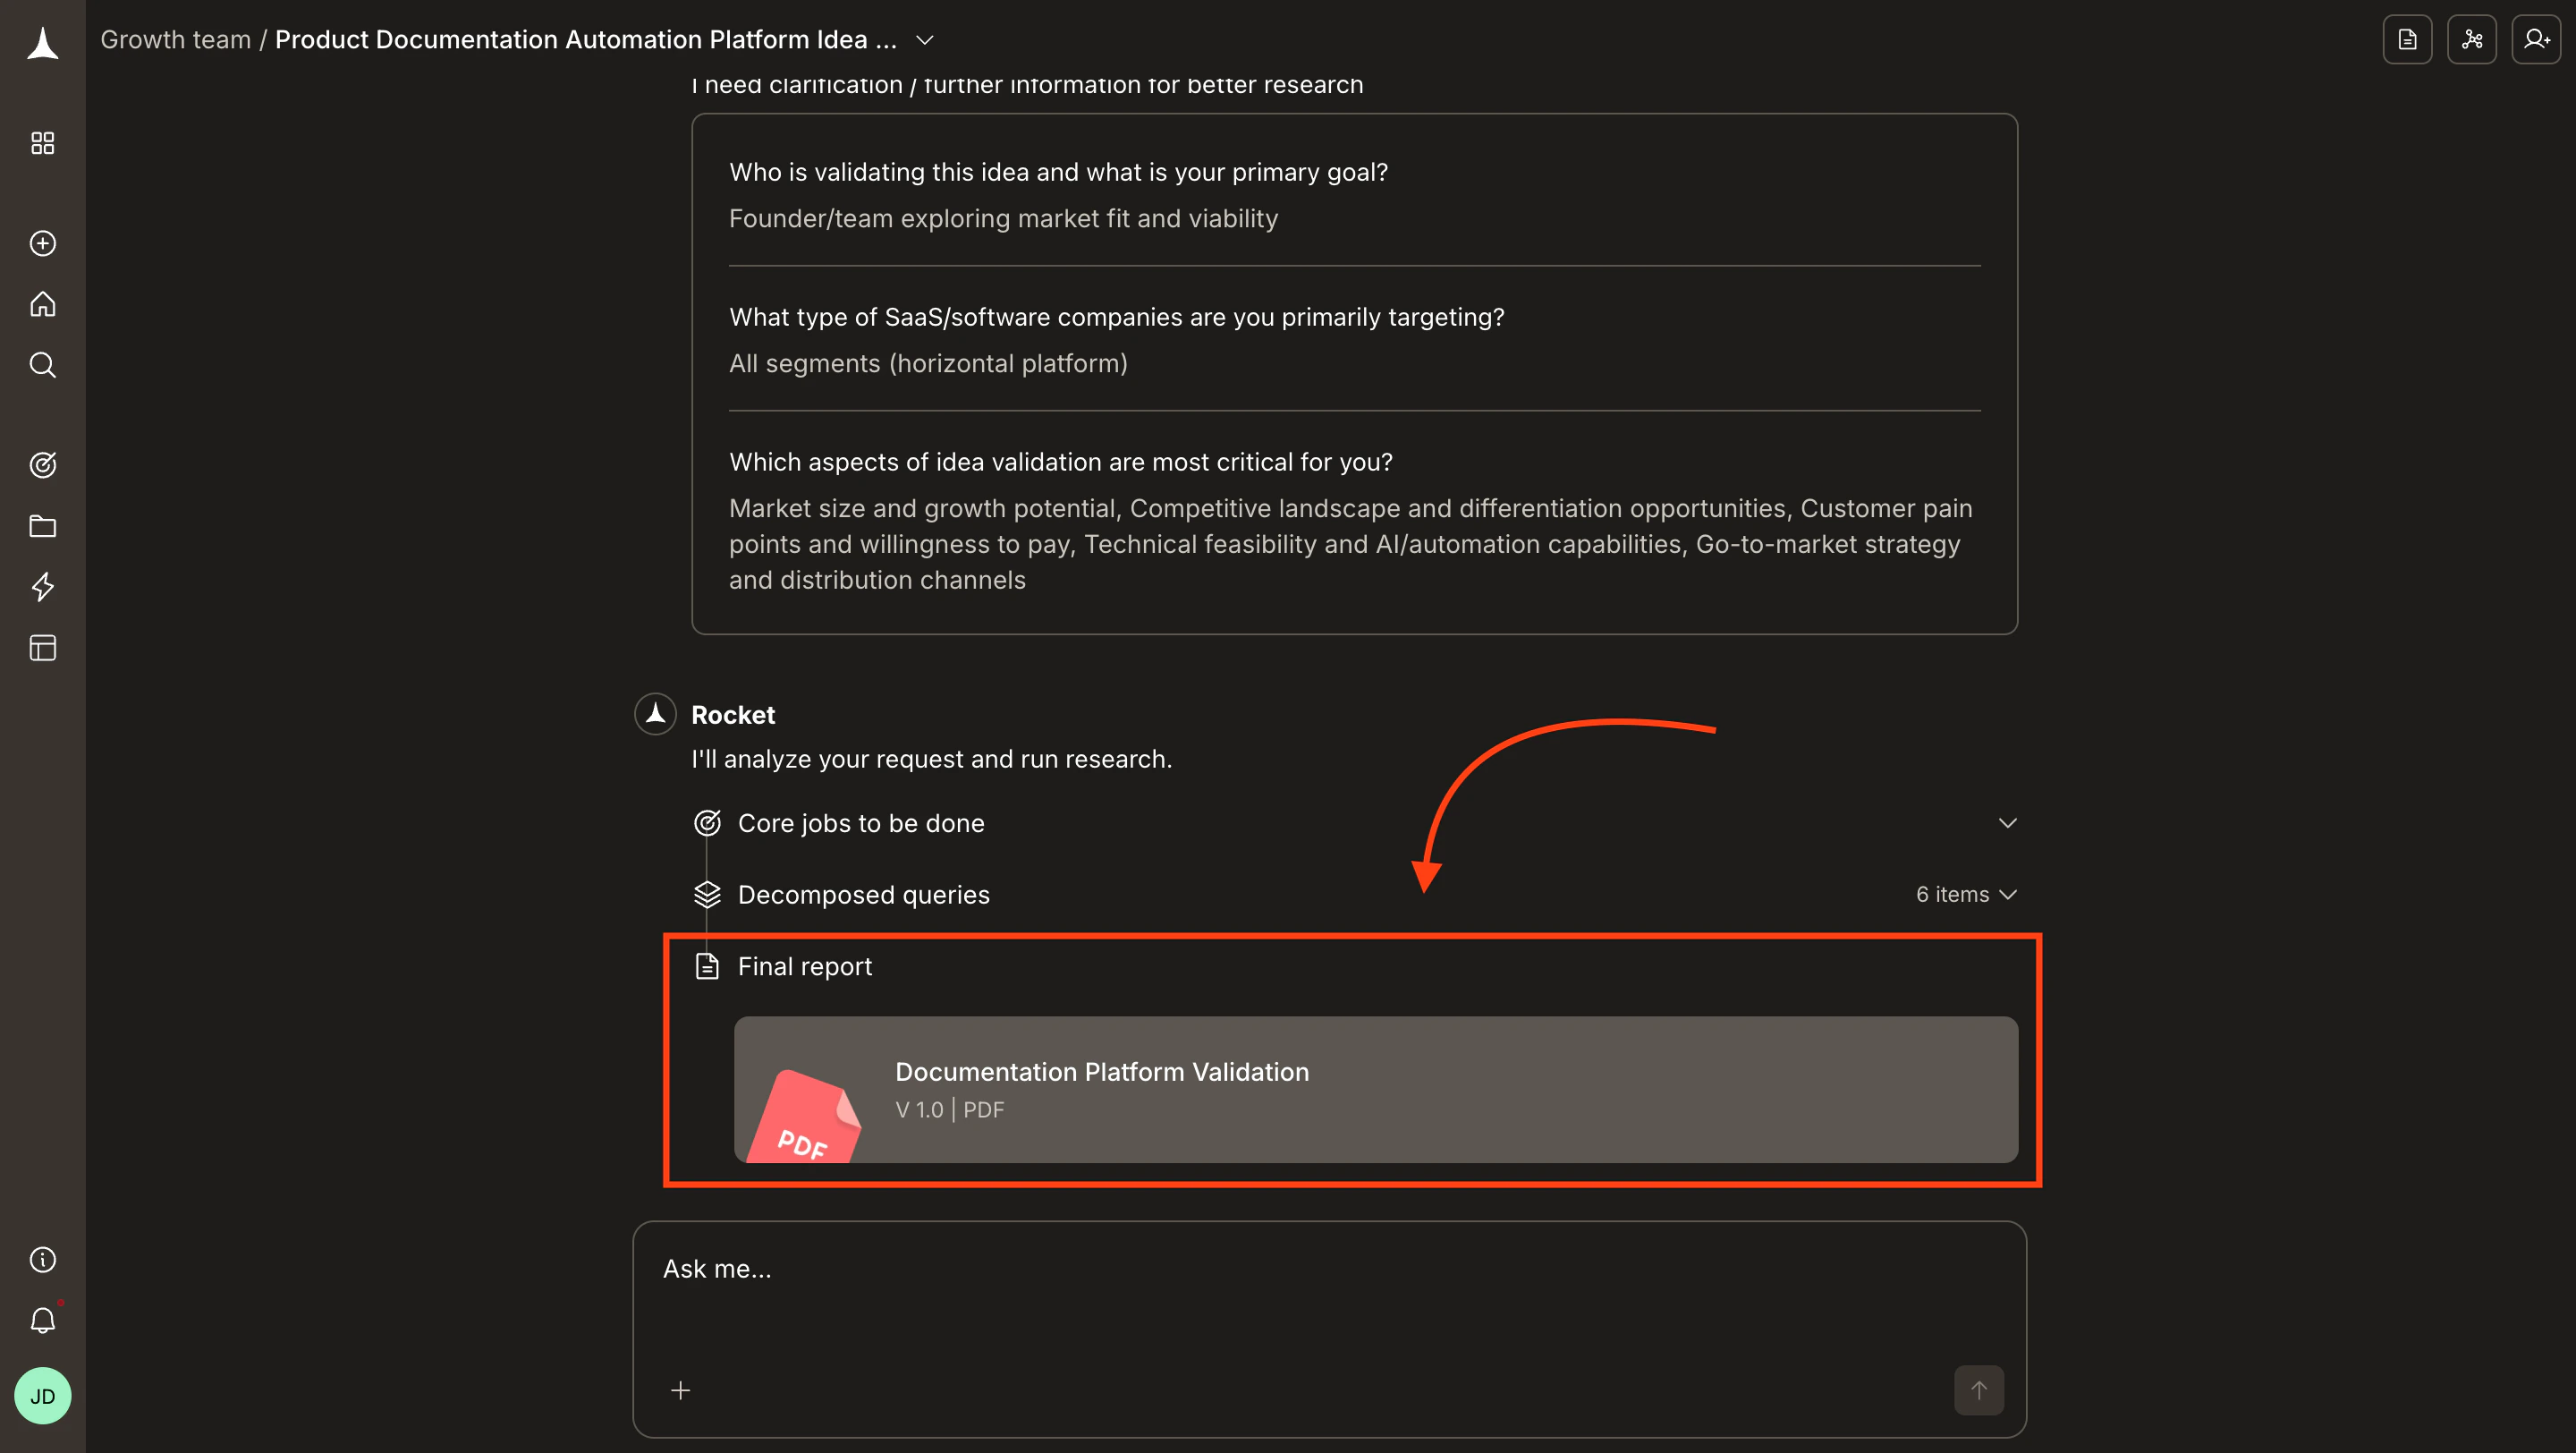
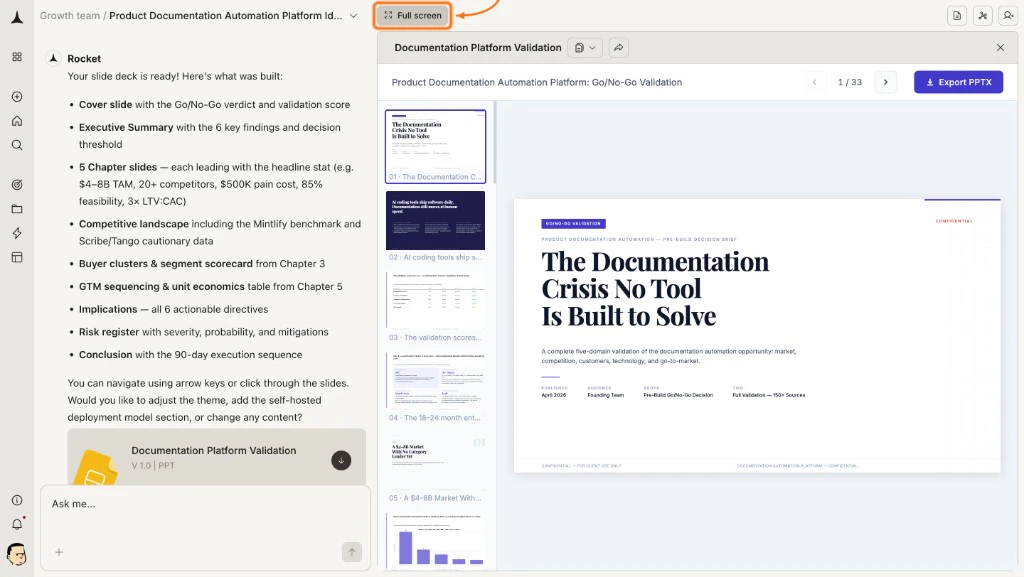
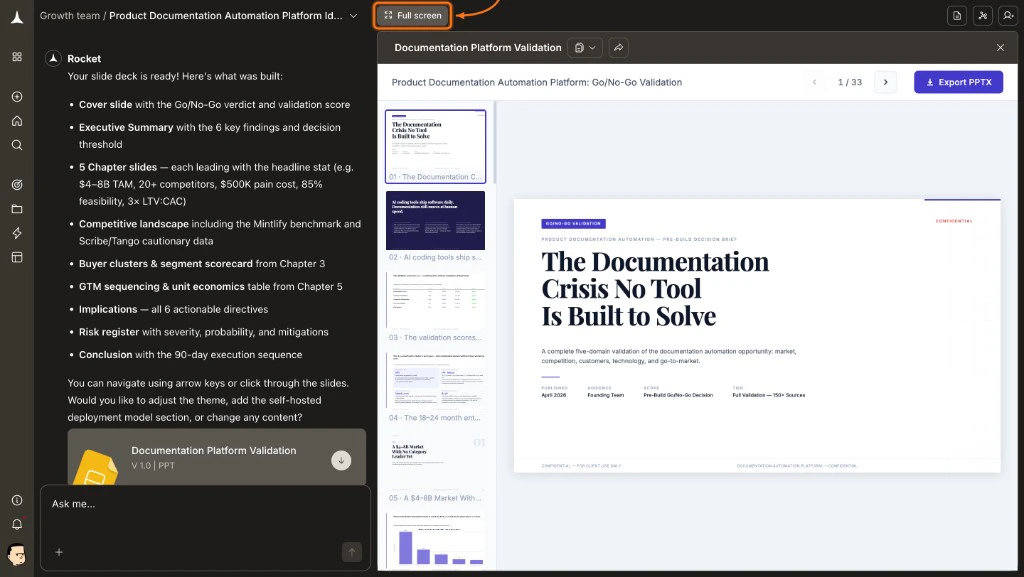
Interface layout
The Solve workspace uses a split-panel design once a report is ready.| Panel | What it shows |
|---|---|
| Left panel (chat) | Your conversation history, research streams, and follow-up messages. The Final report link and versioned document links appear here. |
| Right panel (report) | The rendered report with headings, tables, and recommendations. Stays visible while you continue chatting on the left. |
Report structure
Every Solve report follows a consistent five-part structure, regardless of question type.| Section | What it contains |
|---|---|
| Executive summary | Key findings in two to four sentences. Start here for a quick answer or to decide whether to read further. |
| Detailed analysis | The core of the report. Content varies by question type: market analyses include sizing tables, competitive teardowns include feature matrices, investment analyses include risk assessments. |
| Supporting data | Tables, comparisons, and data points backing up the analysis. Solve shows its work, including where numbers come from and what assumptions were made. |
| Recommendations | Actionable next steps based on the analysis. Specific rather than generic. |
| Sources and methodology | Where the data came from and how the analysis was structured. Use this to evaluate confidence before relying on findings for high-stakes decisions. |
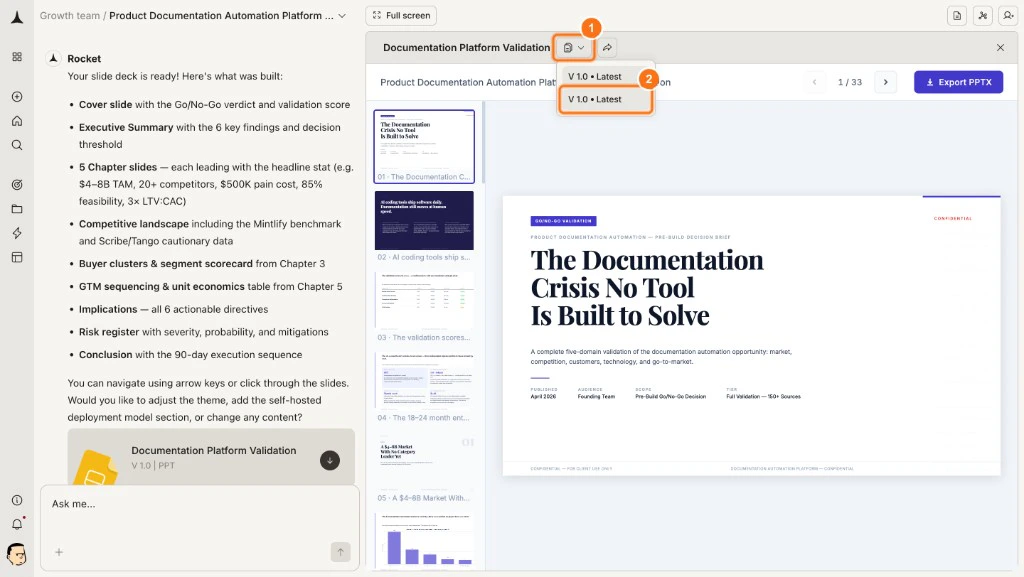
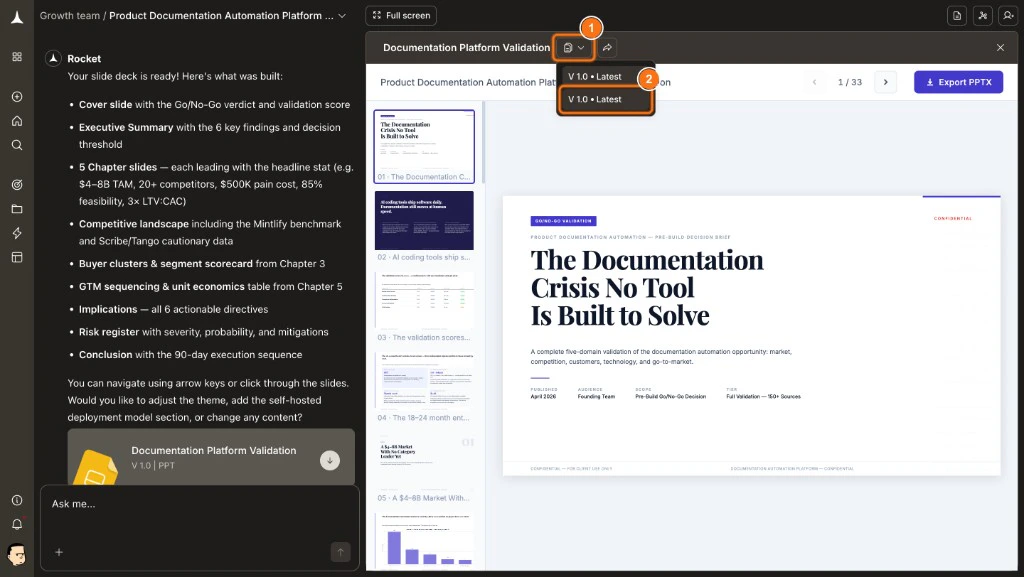
Toolbar
The report toolbar sits at the top of the report panel.| Button | What it does |
|---|---|
| Version dropdown | Shows the current version (e.g. V 1.0, Latest). Switch between all saved versions. Each edit cycle creates a new version. |
| Share | Generates a public link so anyone can view the report without a Rocket account. |
| Full screen | Expands the report to fill the screen. |
| Documents | Lists every report and file Rocket generated in this task. |
| Attachments | Lists all files you uploaded in this task. |
Task collaboration
Invite team members, assign roles, and collaborate on reports together.
Report types
Different question types produce different report structures.| Question type | Key sections | Typical length |
|---|---|---|
| Market analysis | Market sizing, growth drivers, landscape | 800 to 1,500 words |
| Competitive teardowns | Feature matrix, SWOT, gap analysis | 1,000 to 2,000 words |
| Pricing strategy | Pricing tables, model analysis, recommendations | 600 to 1,200 words |
| Product direction | Prioritization framework, evidence, tradeoffs | 800 to 1,500 words |
| Investment analysis | Thesis, financials, risk matrix, recommendation | 1,000 to 2,000 words |
What’s next
Refine
Query, modify, and extend reports through conversation.
Presentable report
Generate a polished HTML page or PPT deck in one message.
Share and export
Share via link, export as PDF, or copy content to other tools.