You need a Rocket account to follow along. If you have not signed up yet, create an account first.
Walkthrough
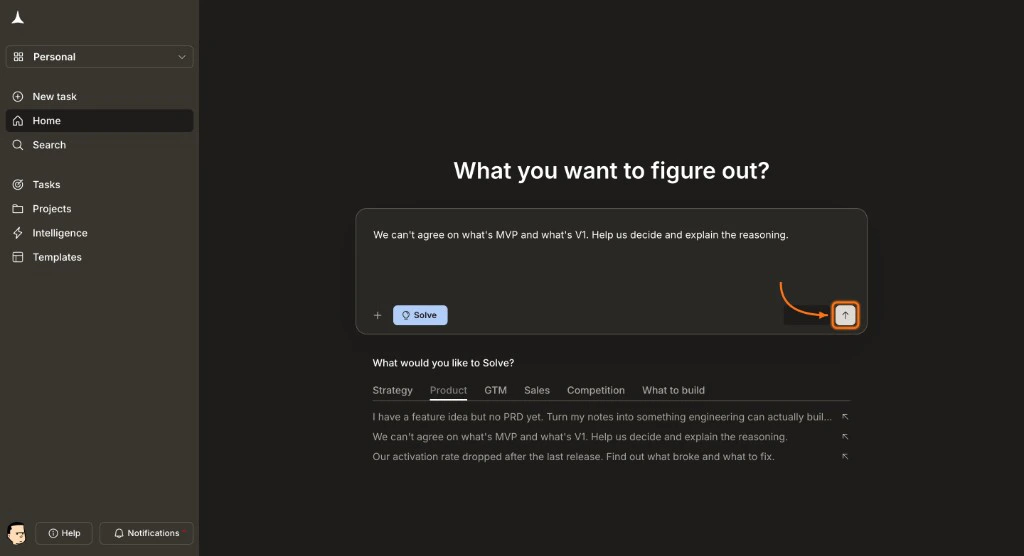
Select Solve from the home screen
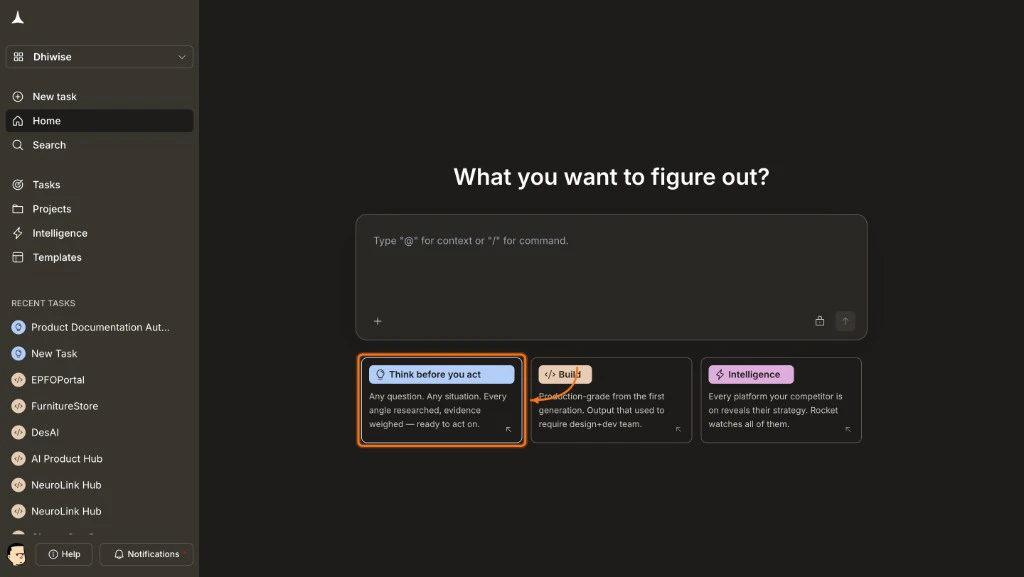
After logging in, the home screen presents three options: Solve, Build, and Intelligence. Select the Solve card to open the research interface.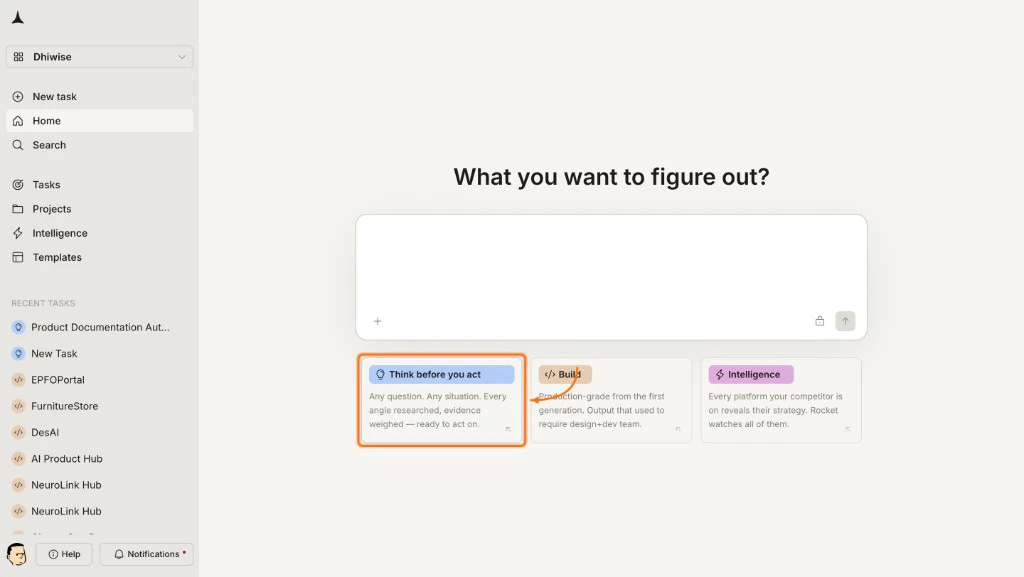
Enter your question
A centered input box appears. Type a specific business question, or pick a suggestion category below the input to see pre-framed examples.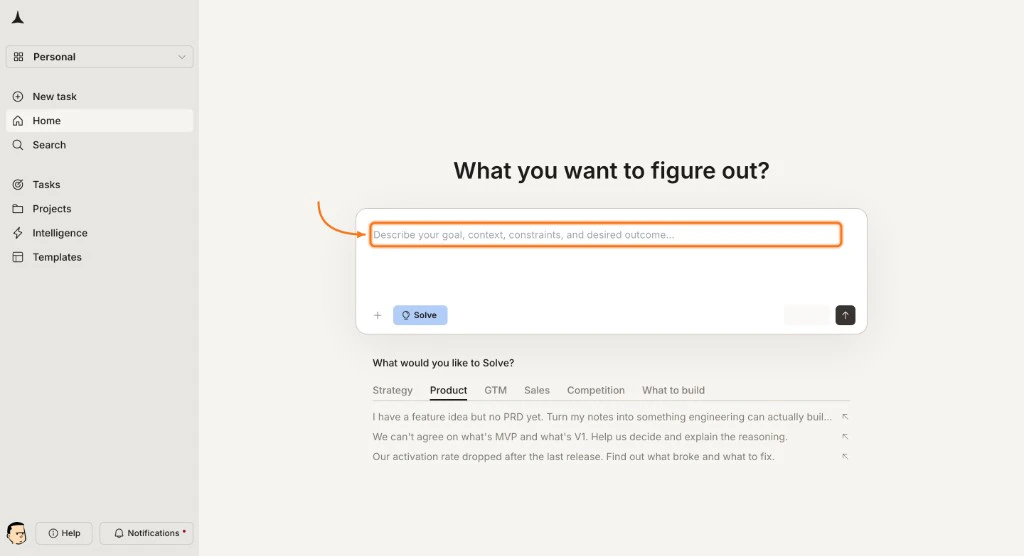
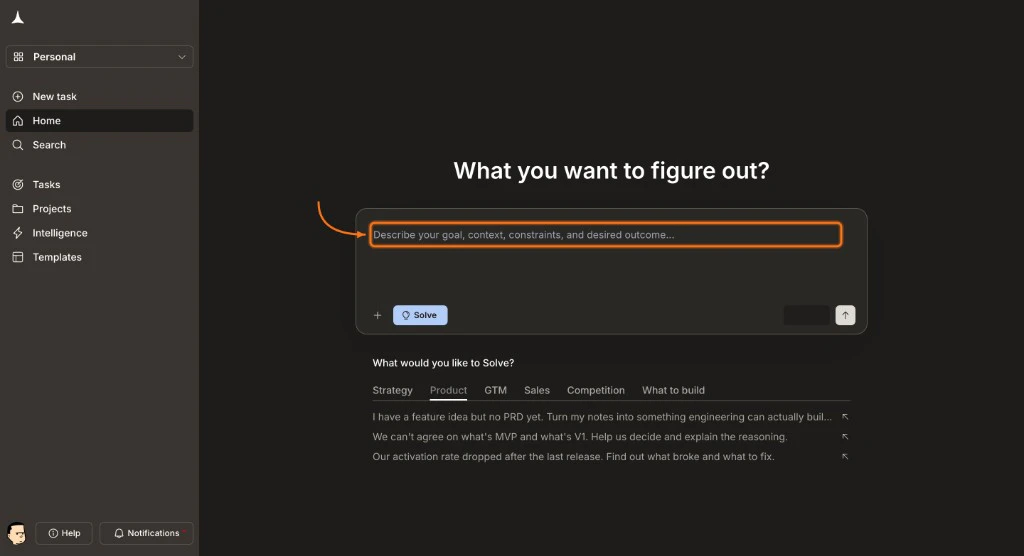
For this walkthrough, try:Press Enter or click Send to submit. For guidance on writing effective prompts, see question framing best practices.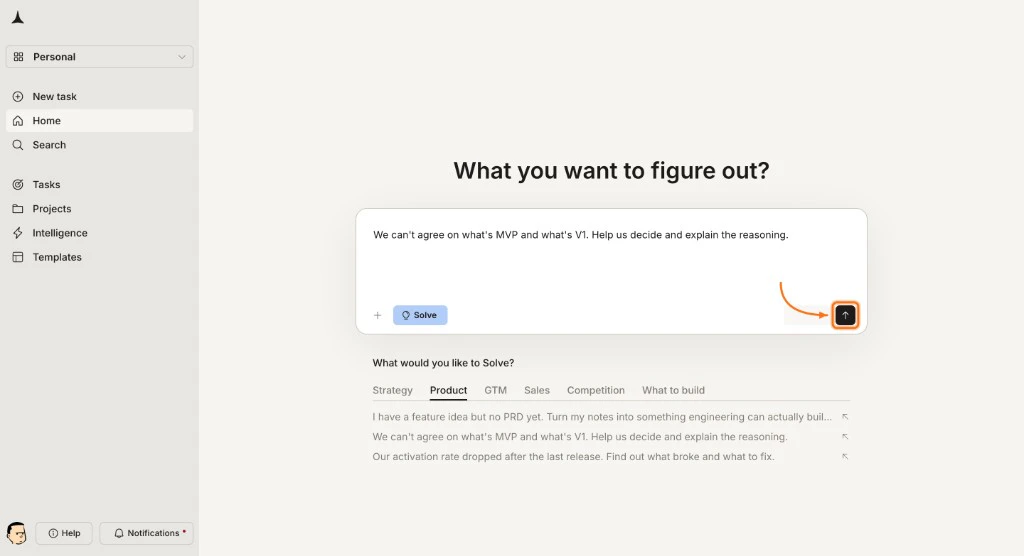
| Category | What it covers |
|---|---|
| Strategy | Business strategy, market entry, growth planning |
| Product | Feature prioritization, roadmap decisions, product-market fit |
| GTM | Go-to-market strategy, sales motions, channel selection |
| Sales | Revenue optimization, deal cycles, conversion improvement |
| Competition | Competitive landscape, positioning, feature comparisons |
| What to build | Idea validation, technical feasibility, MVP scoping |
Answer follow-up questions (if needed)
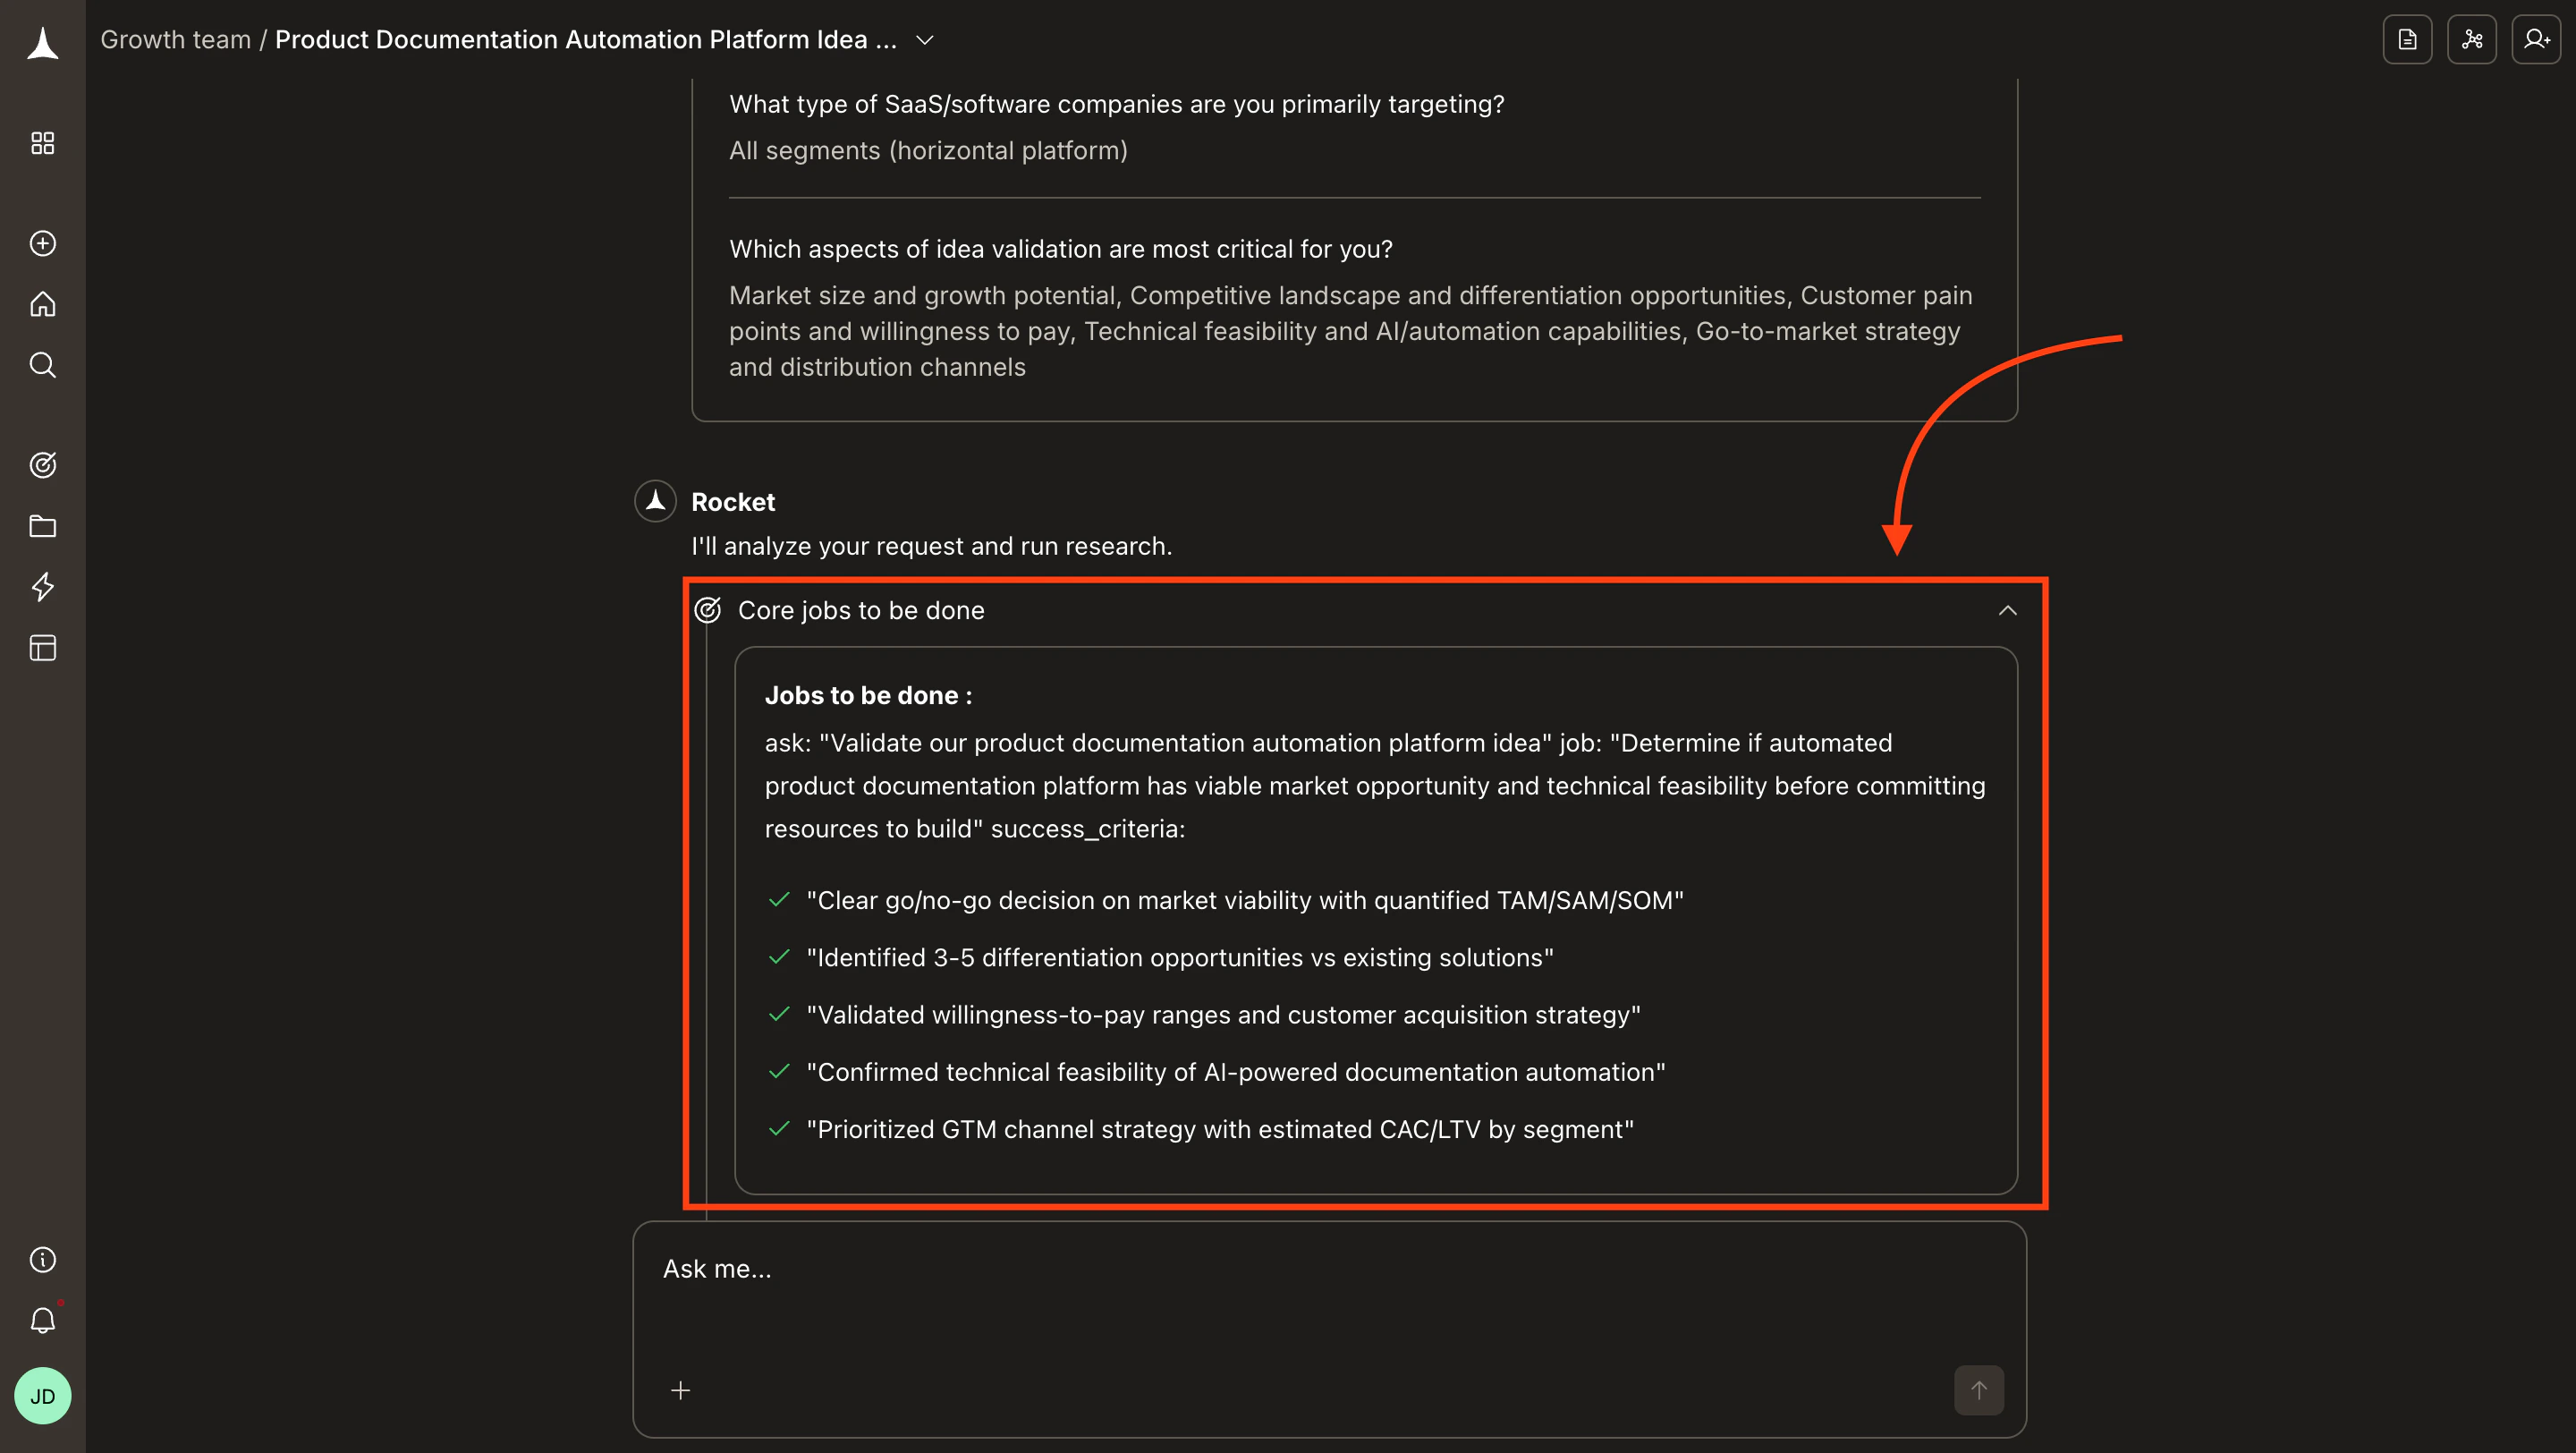
Solve may use prompt intelligence before it begins research. These help narrow the scope and produce a more targeted report. Answer the questions and click Submit to continue.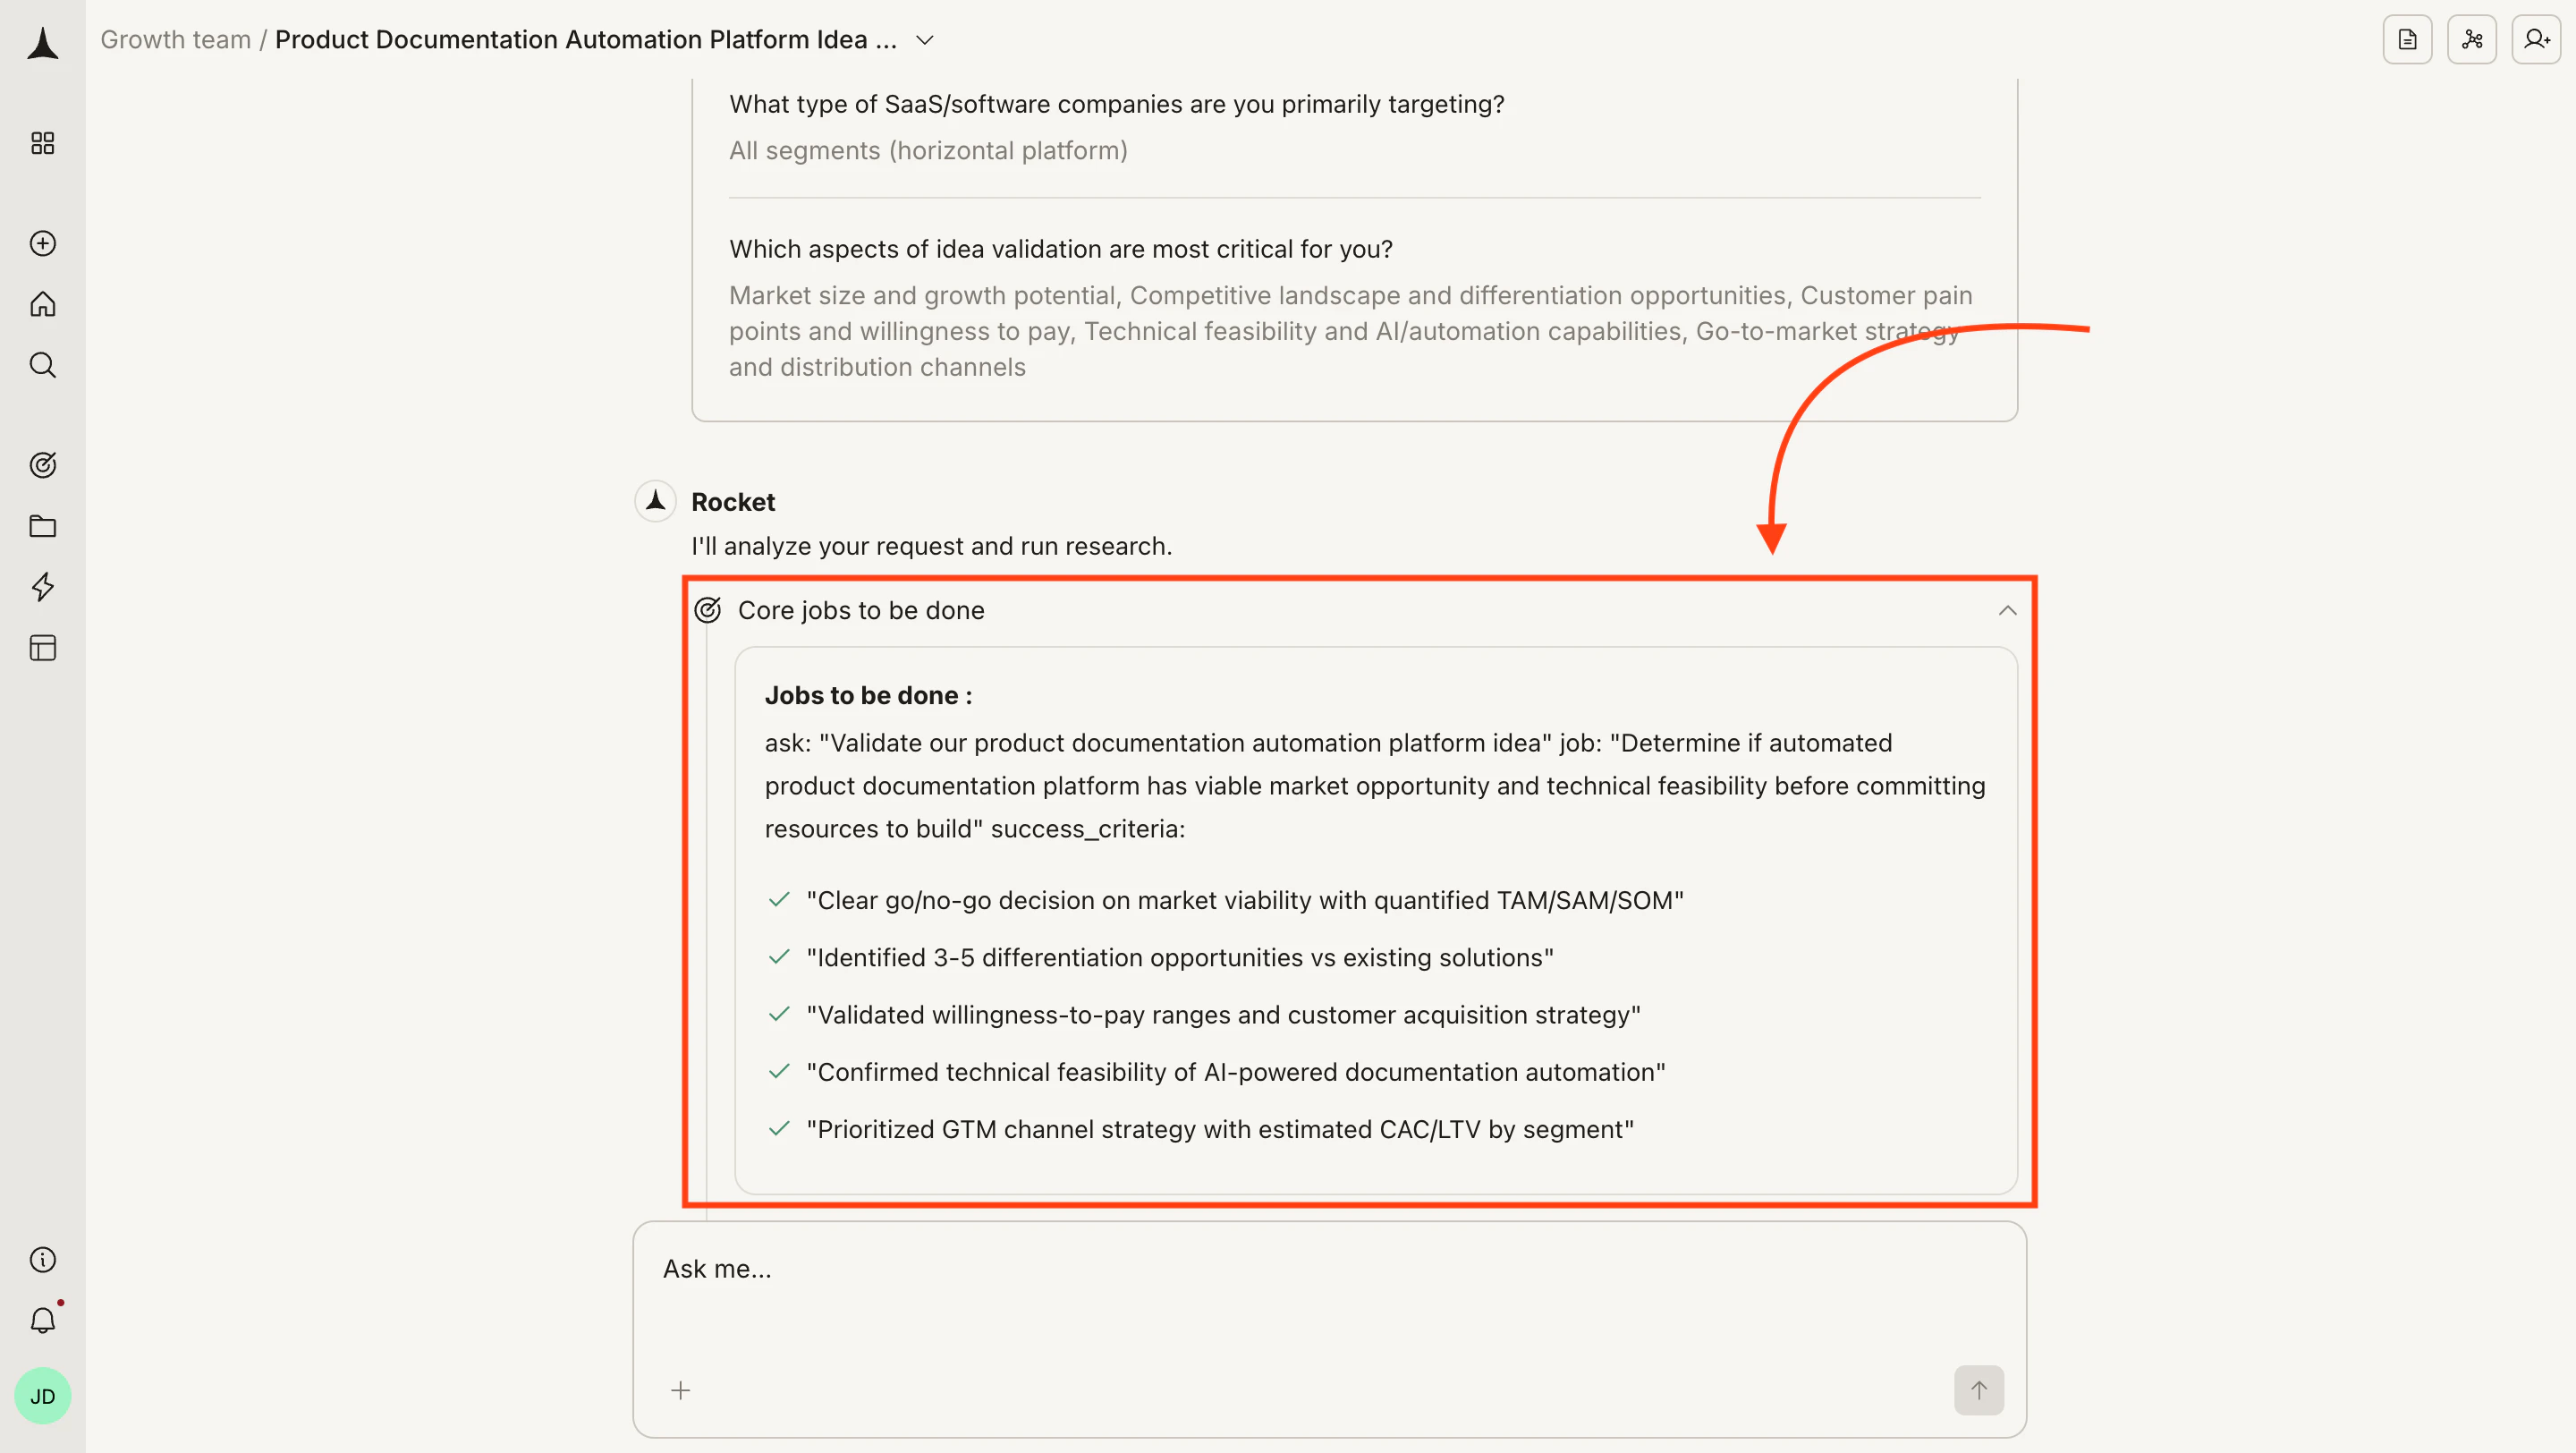
Prompt intelligence
Learn when Solve asks questions and how to write prompts that skip them.
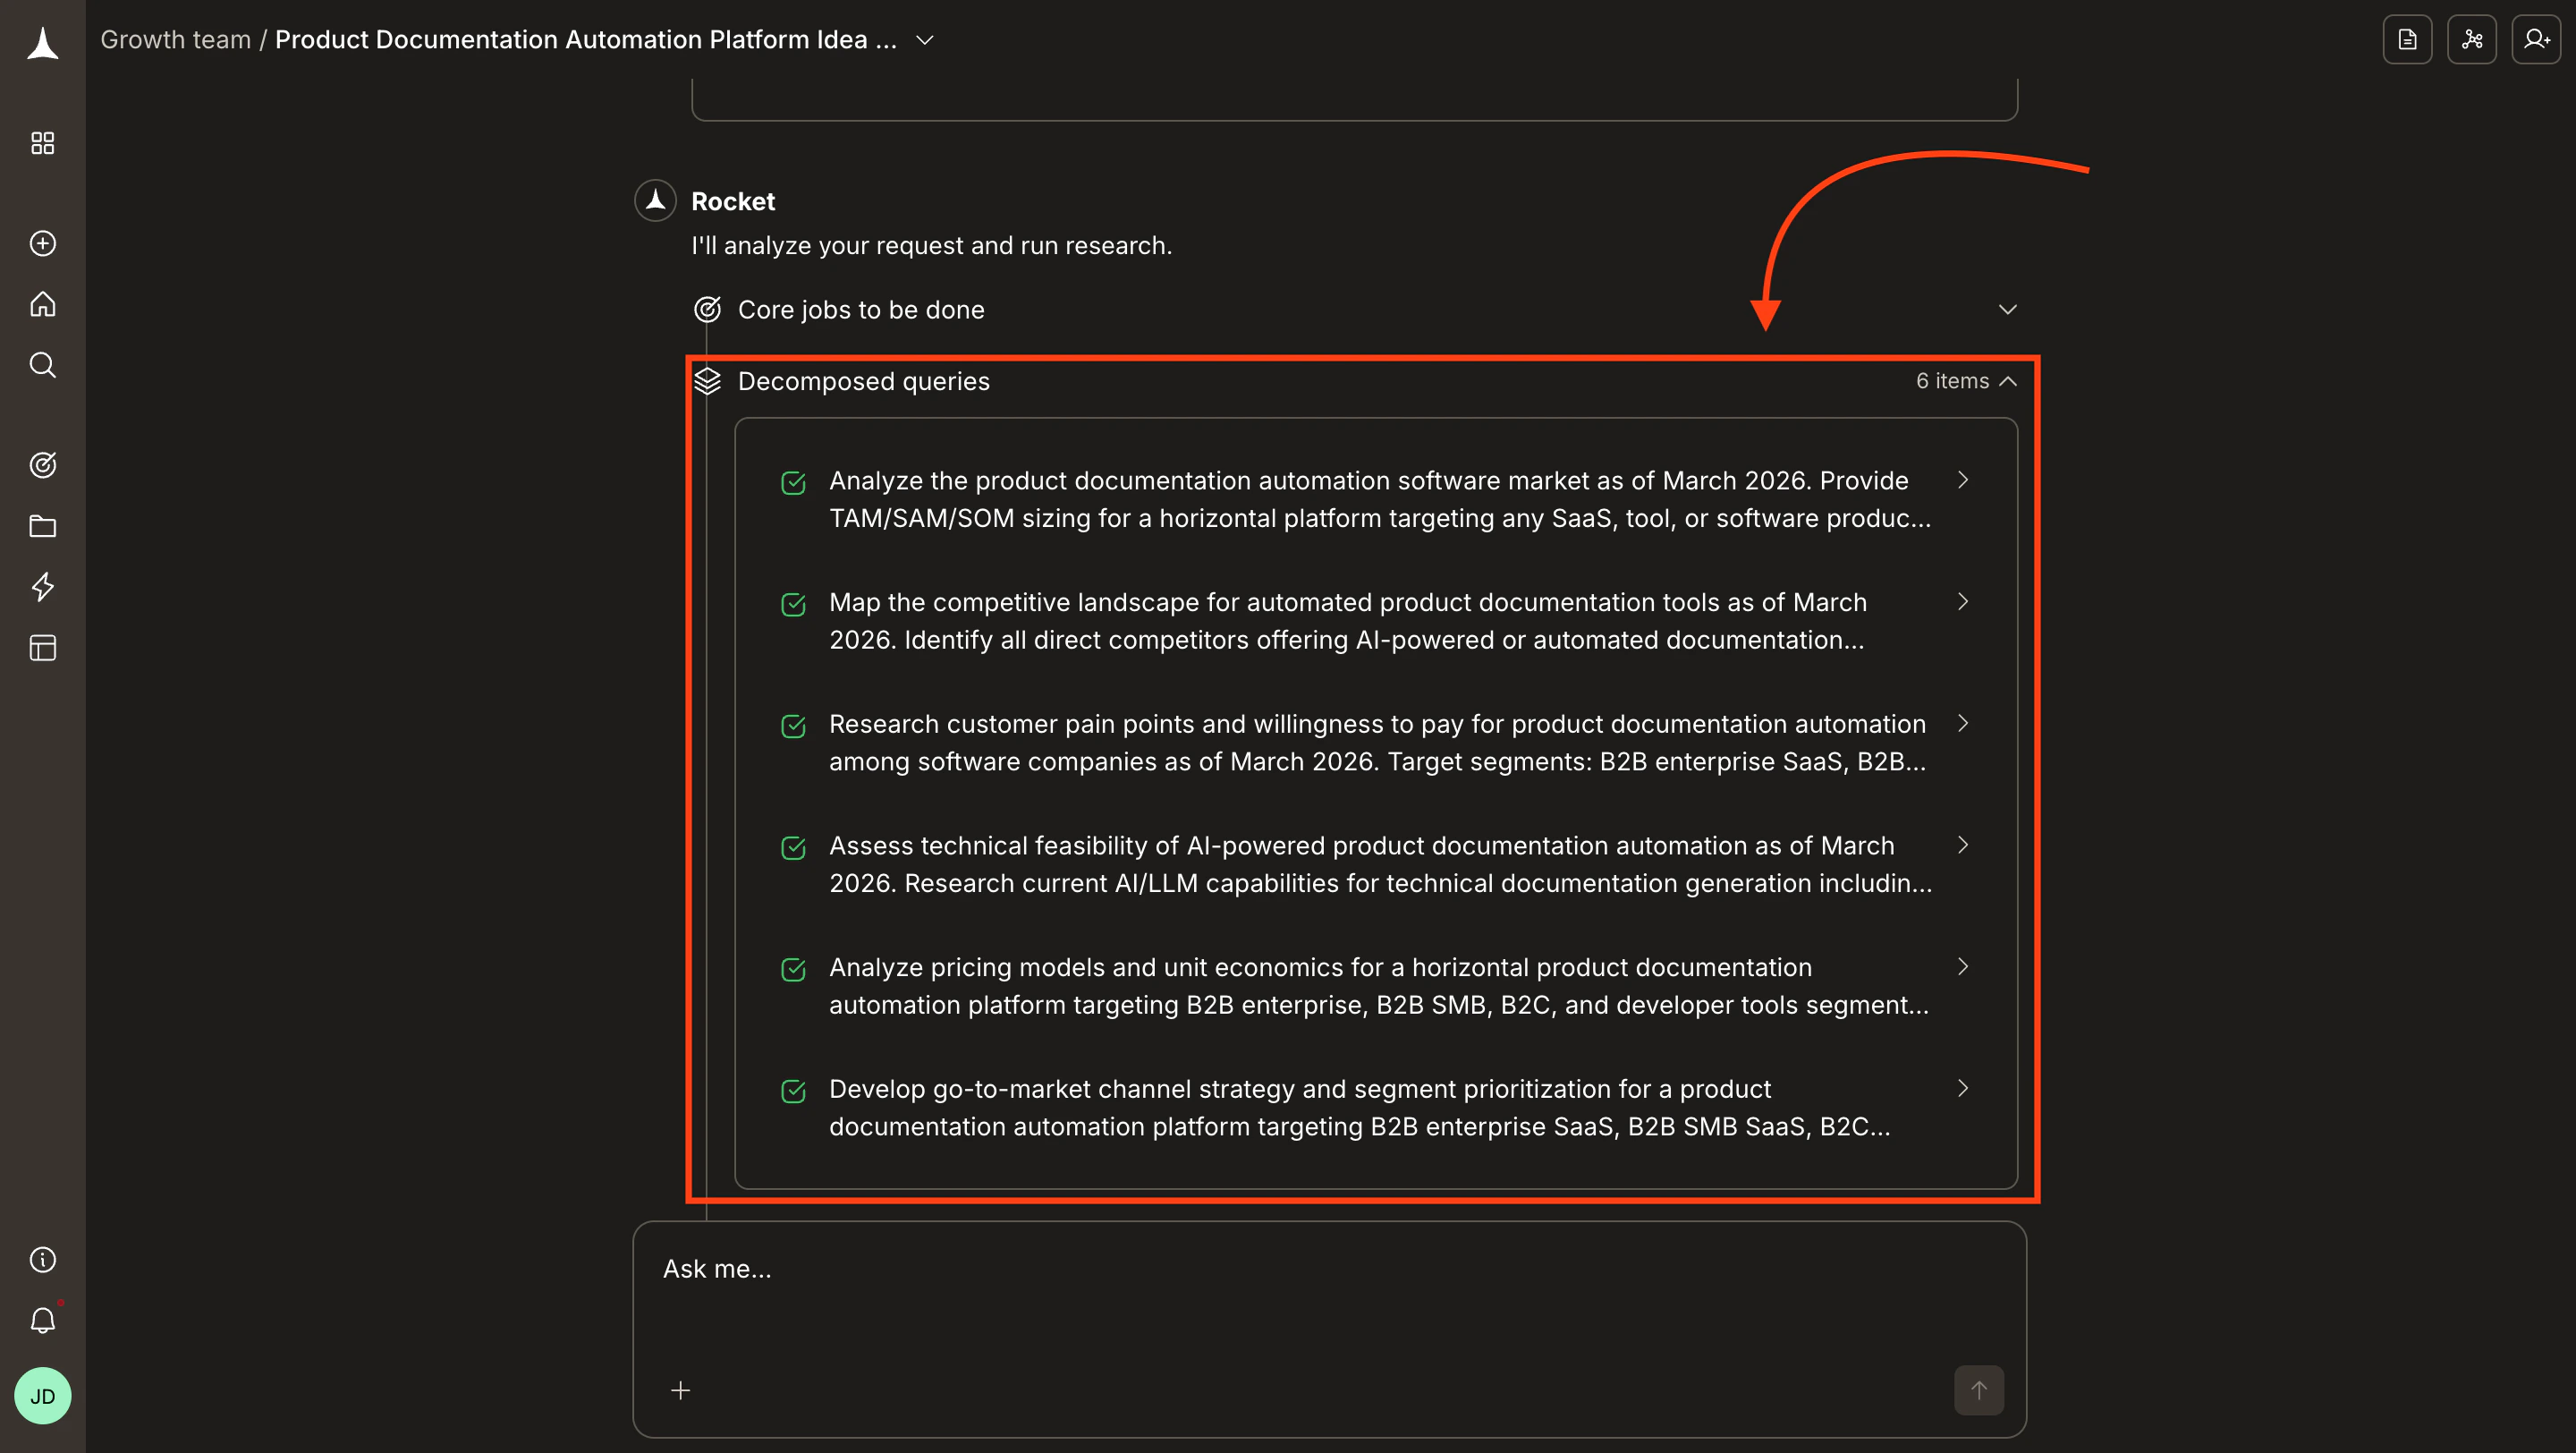
Watch the research pipeline
Solve defines a research objective, breaks it into individual queries, then runs each as a parallel agent stream. You can watch progress in the chat as each stream completes.
Most reports finish in one to three minutes. Click Notify me in the banner to receive a browser notification when the report is ready.
| Element | What it means |
|---|---|
| Positives and negatives | Key findings that support or challenge the research direction |
| Data | Specific numbers, tables, and data points collected |
| Tools used | Sources and research tools the agents referenced |
| Research performed | What searches and analyses ran for this stream |
| Assessment | How the agent interpreted and weighted the findings |
Task notifications
Step away and get notified when your report is ready.
Review the report
A Final report link appears in the chat once all streams complete. Click it to open the report in the right panel while the chat stays on the left.Each refinement creates a new version, accessible from the version dropdown.
Reports
See the full breakdown of report sections and how to export them.
Example output
- Executive summary
- Market sizing
- Key players
- Recommendations
The global market for AI-powered documentation tools is estimated at $4.2B (TAM) in 2025. The serviceable addressable market is $1.8B, focused on enterprise and mid-market segments. A new entrant can target roughly $120 to $180M (SOM) in the first three years. The market is growing at a 24% CAGR, driven by enterprise AI adoption and automated knowledge management.
What’s next
Reports
Learn how reports are organized and how to export them as HTML or PPT.
Best practices
Improve report quality with proven question-framing techniques.
Run a competitive teardown
Compare competitors side by side with structured research.