What it watches
- Funding and capital activity: rounds raised, investors, valuation changes, and runway signals
- Revenue signals: publicly inferable revenue indicators, growth metrics shared publicly, ARR milestones
- Financial health: burn rate indicators, profitability signals, and market confidence
- Pricing strategy evolution: model shifts (seat-based to usage-based, freemium changes, tier restructuring)
- Partnerships: major customer relationships, integration partnerships, co-selling, and ecosystem moves
- Monetization posture: how aggressively they monetize and what it signals about growth stage
Sub-tabs
Overview
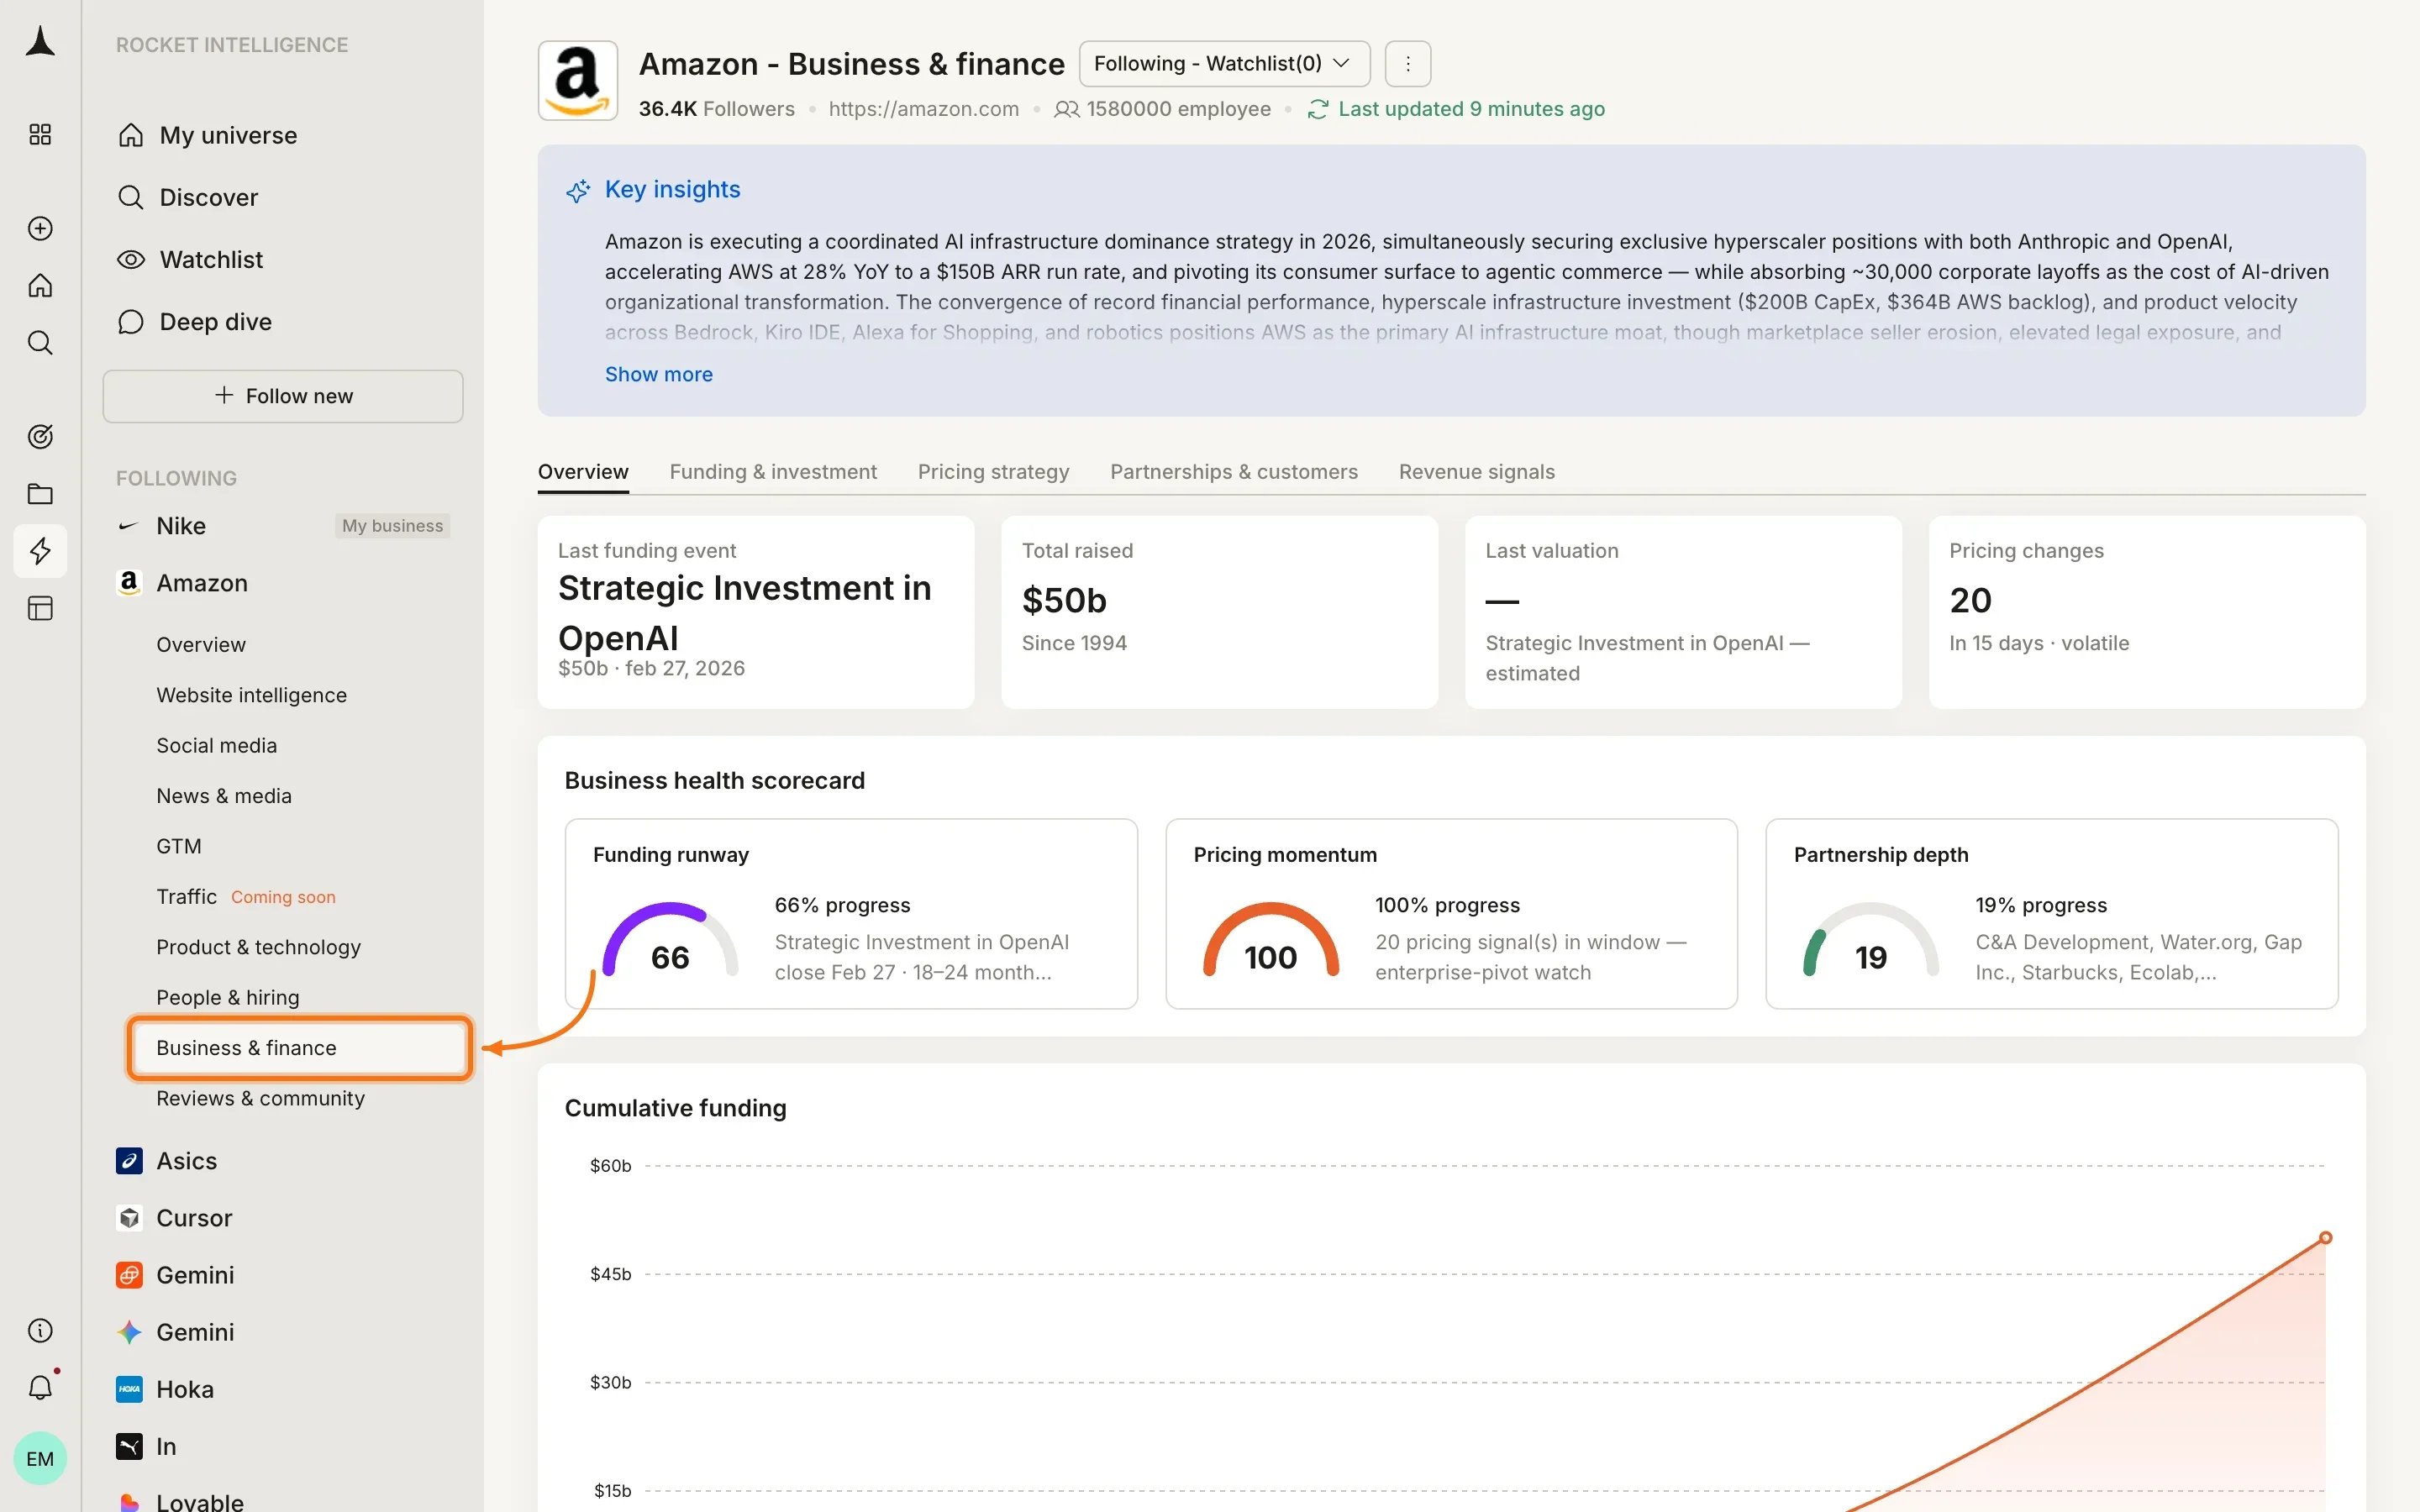
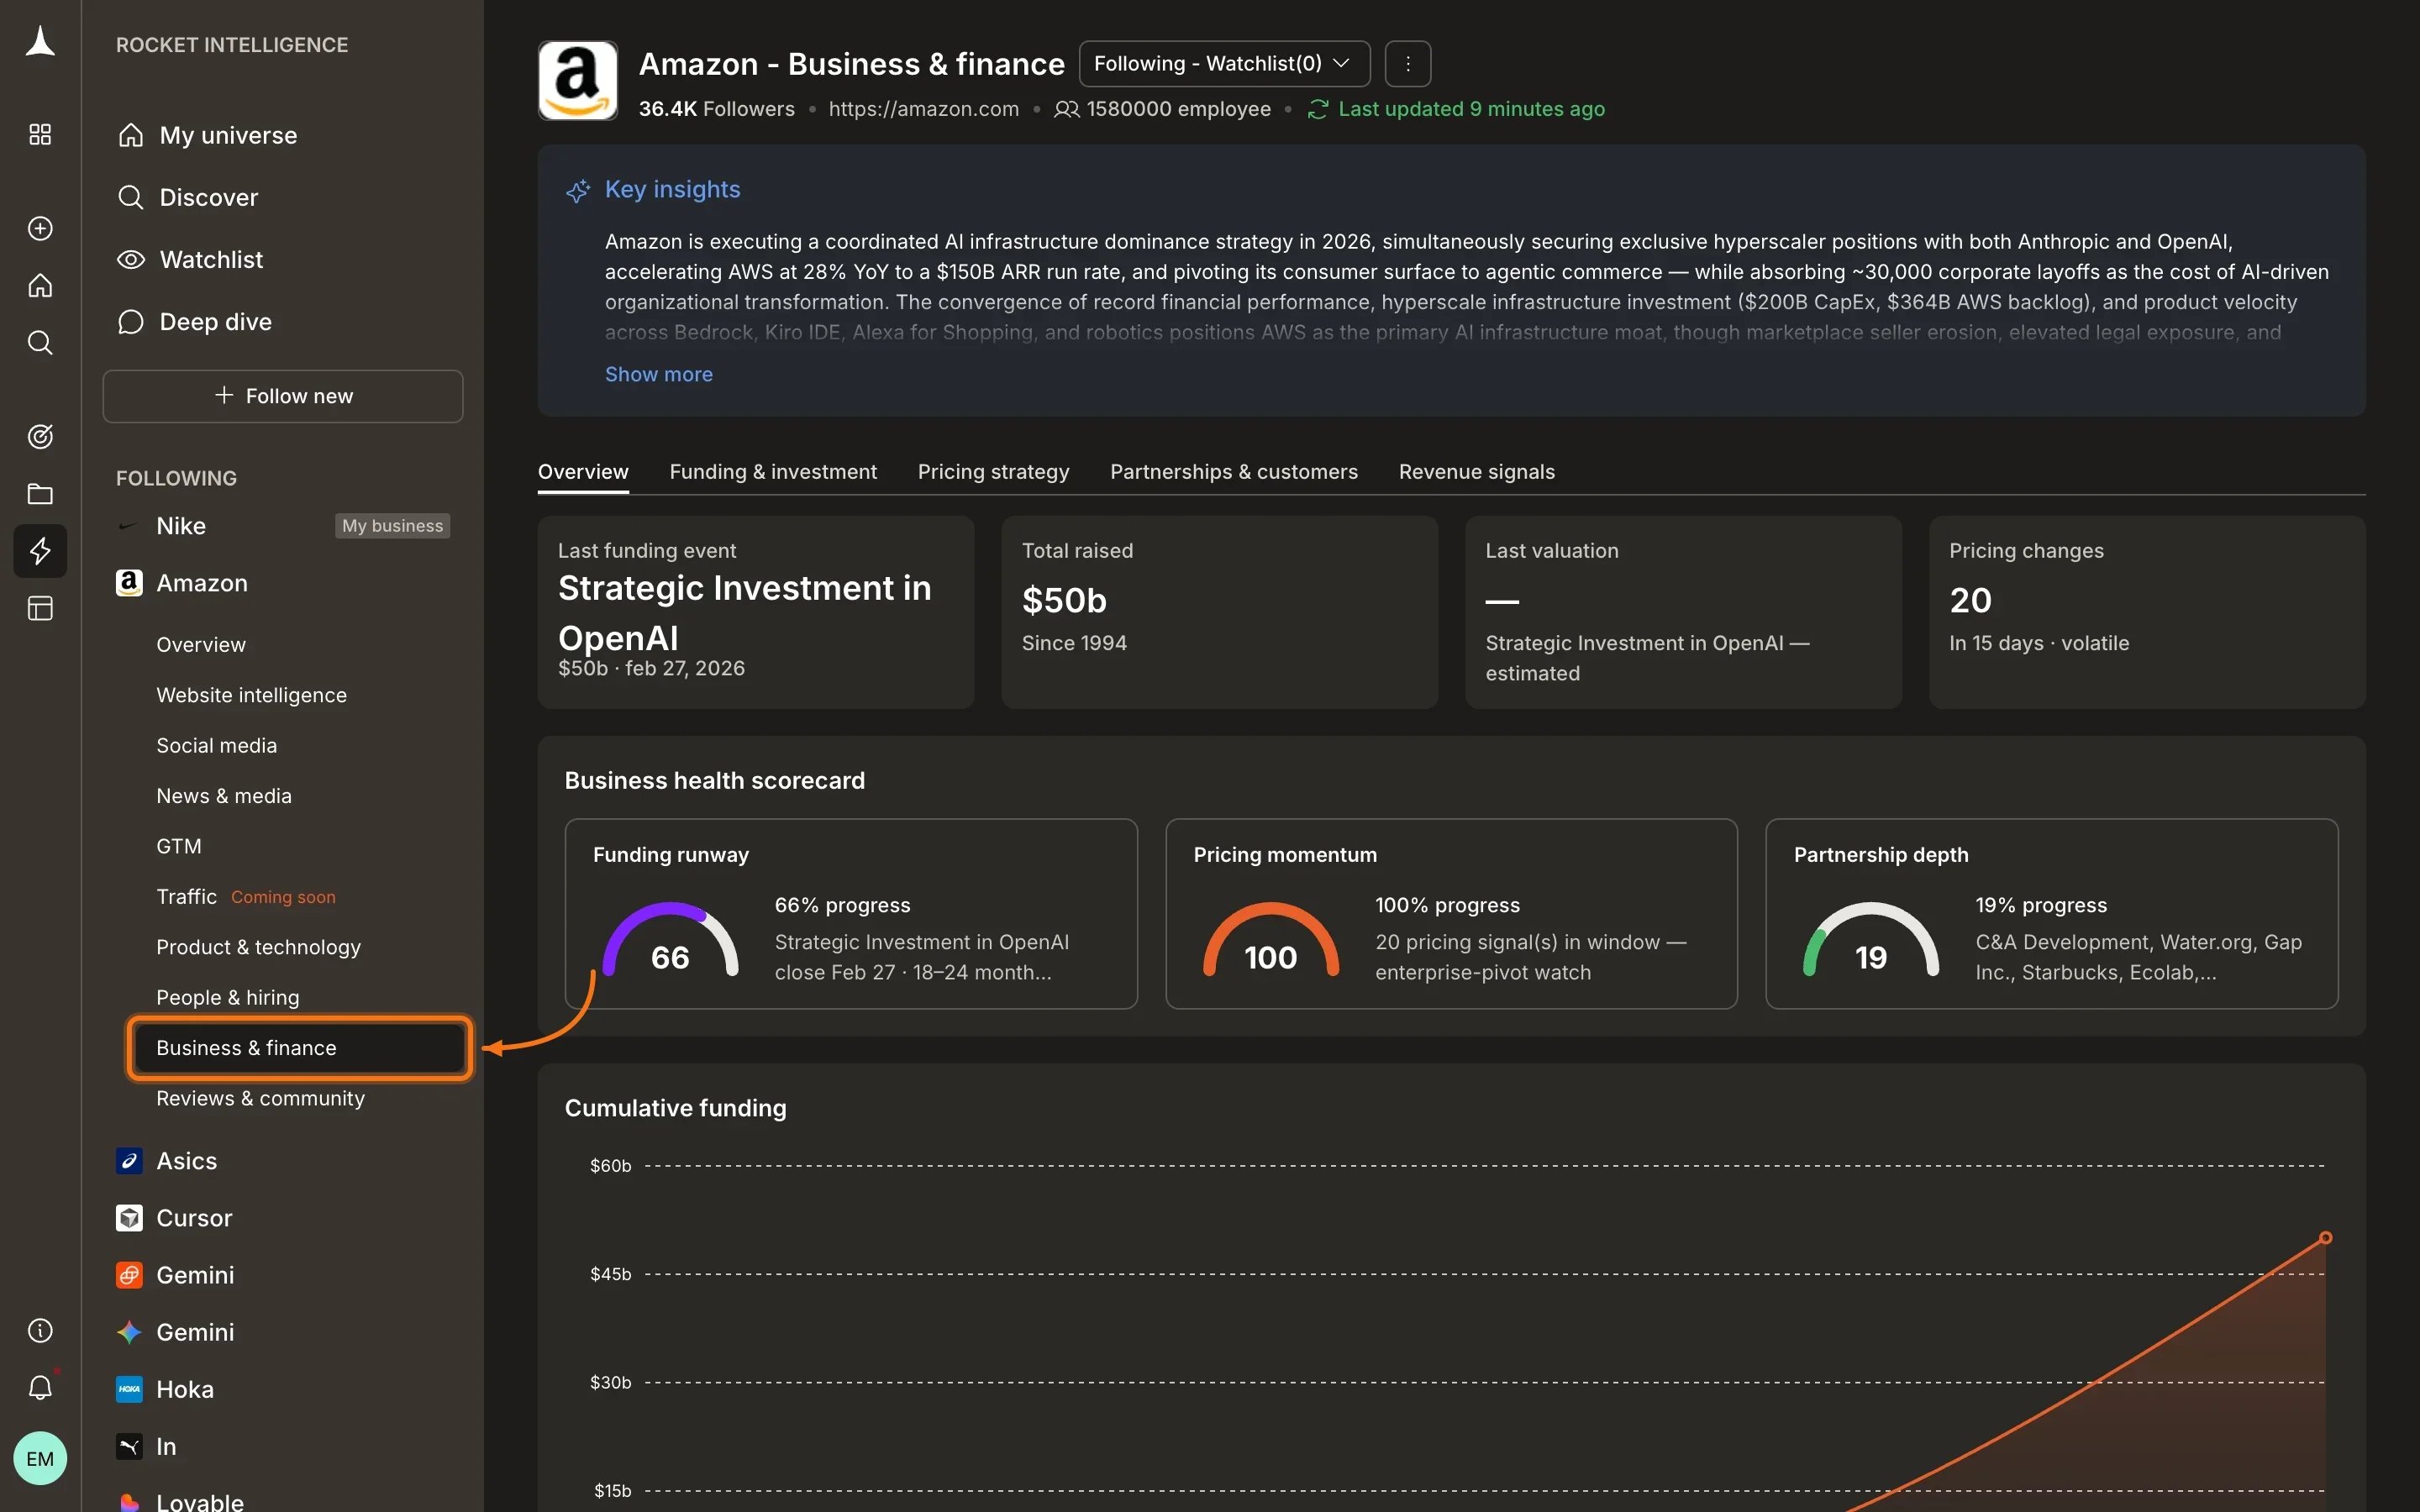
A cross-tab summary of commercial activity including funding status, pricing model classification, partnership count, and revenue signal highlights.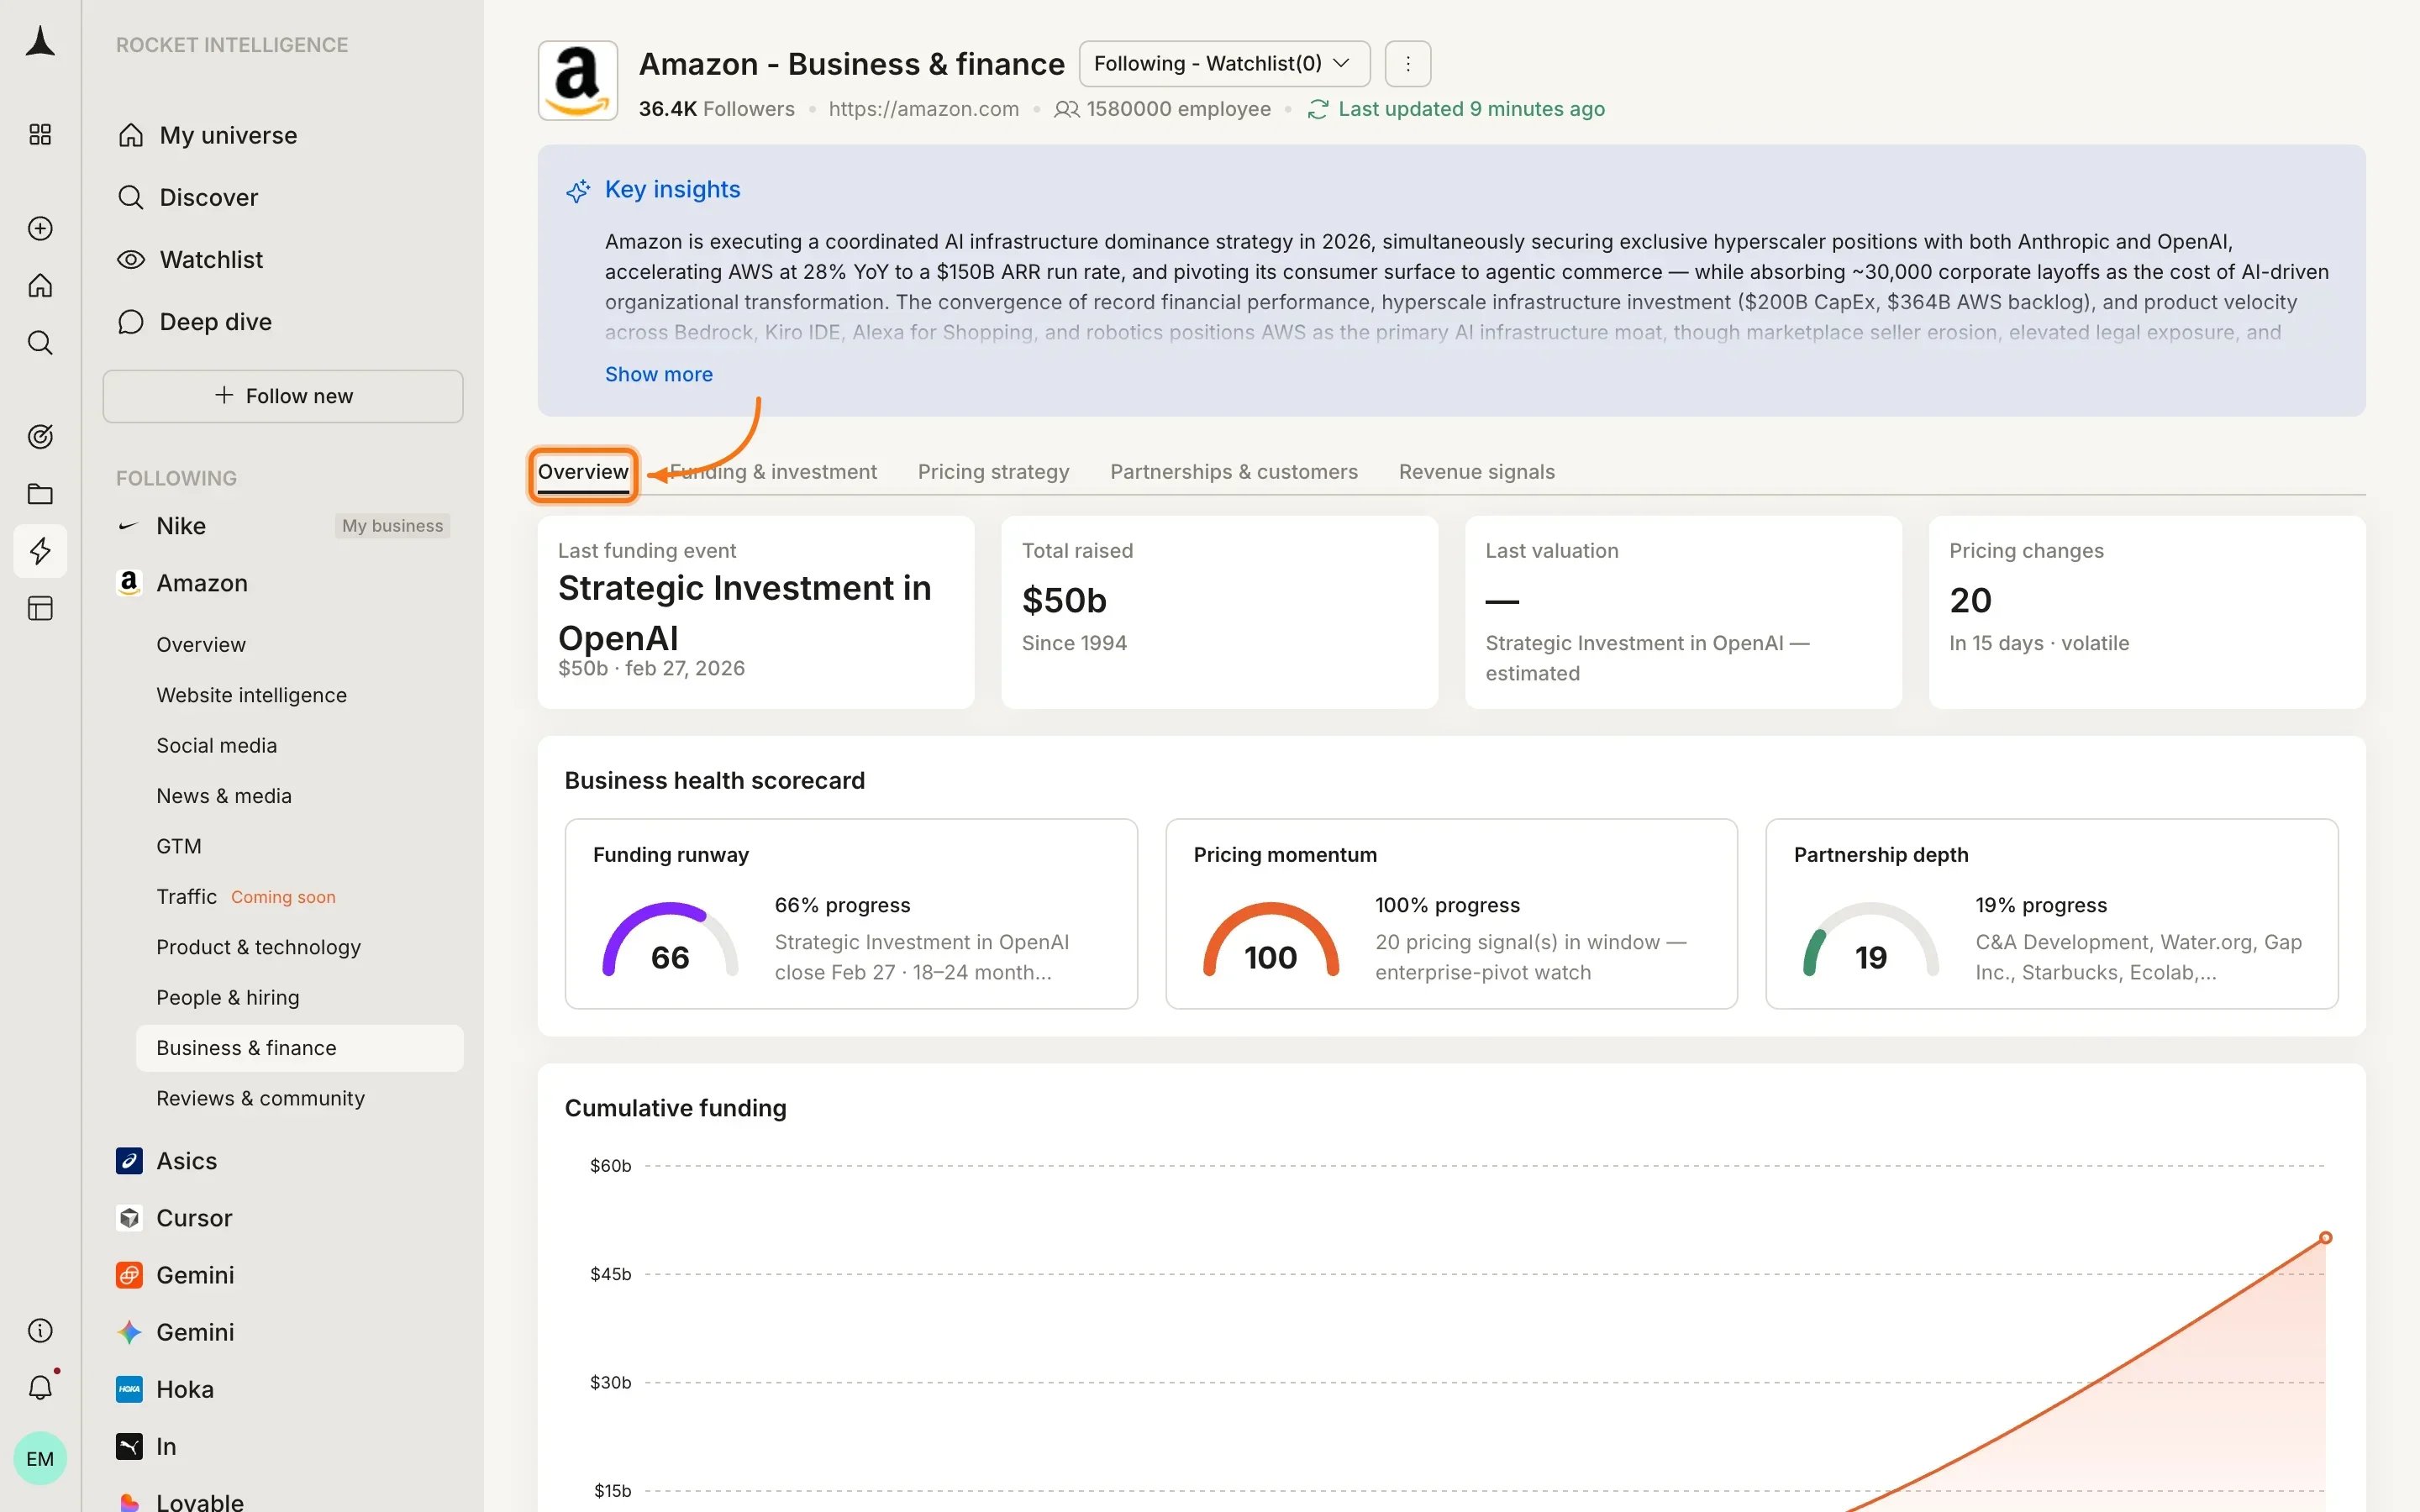
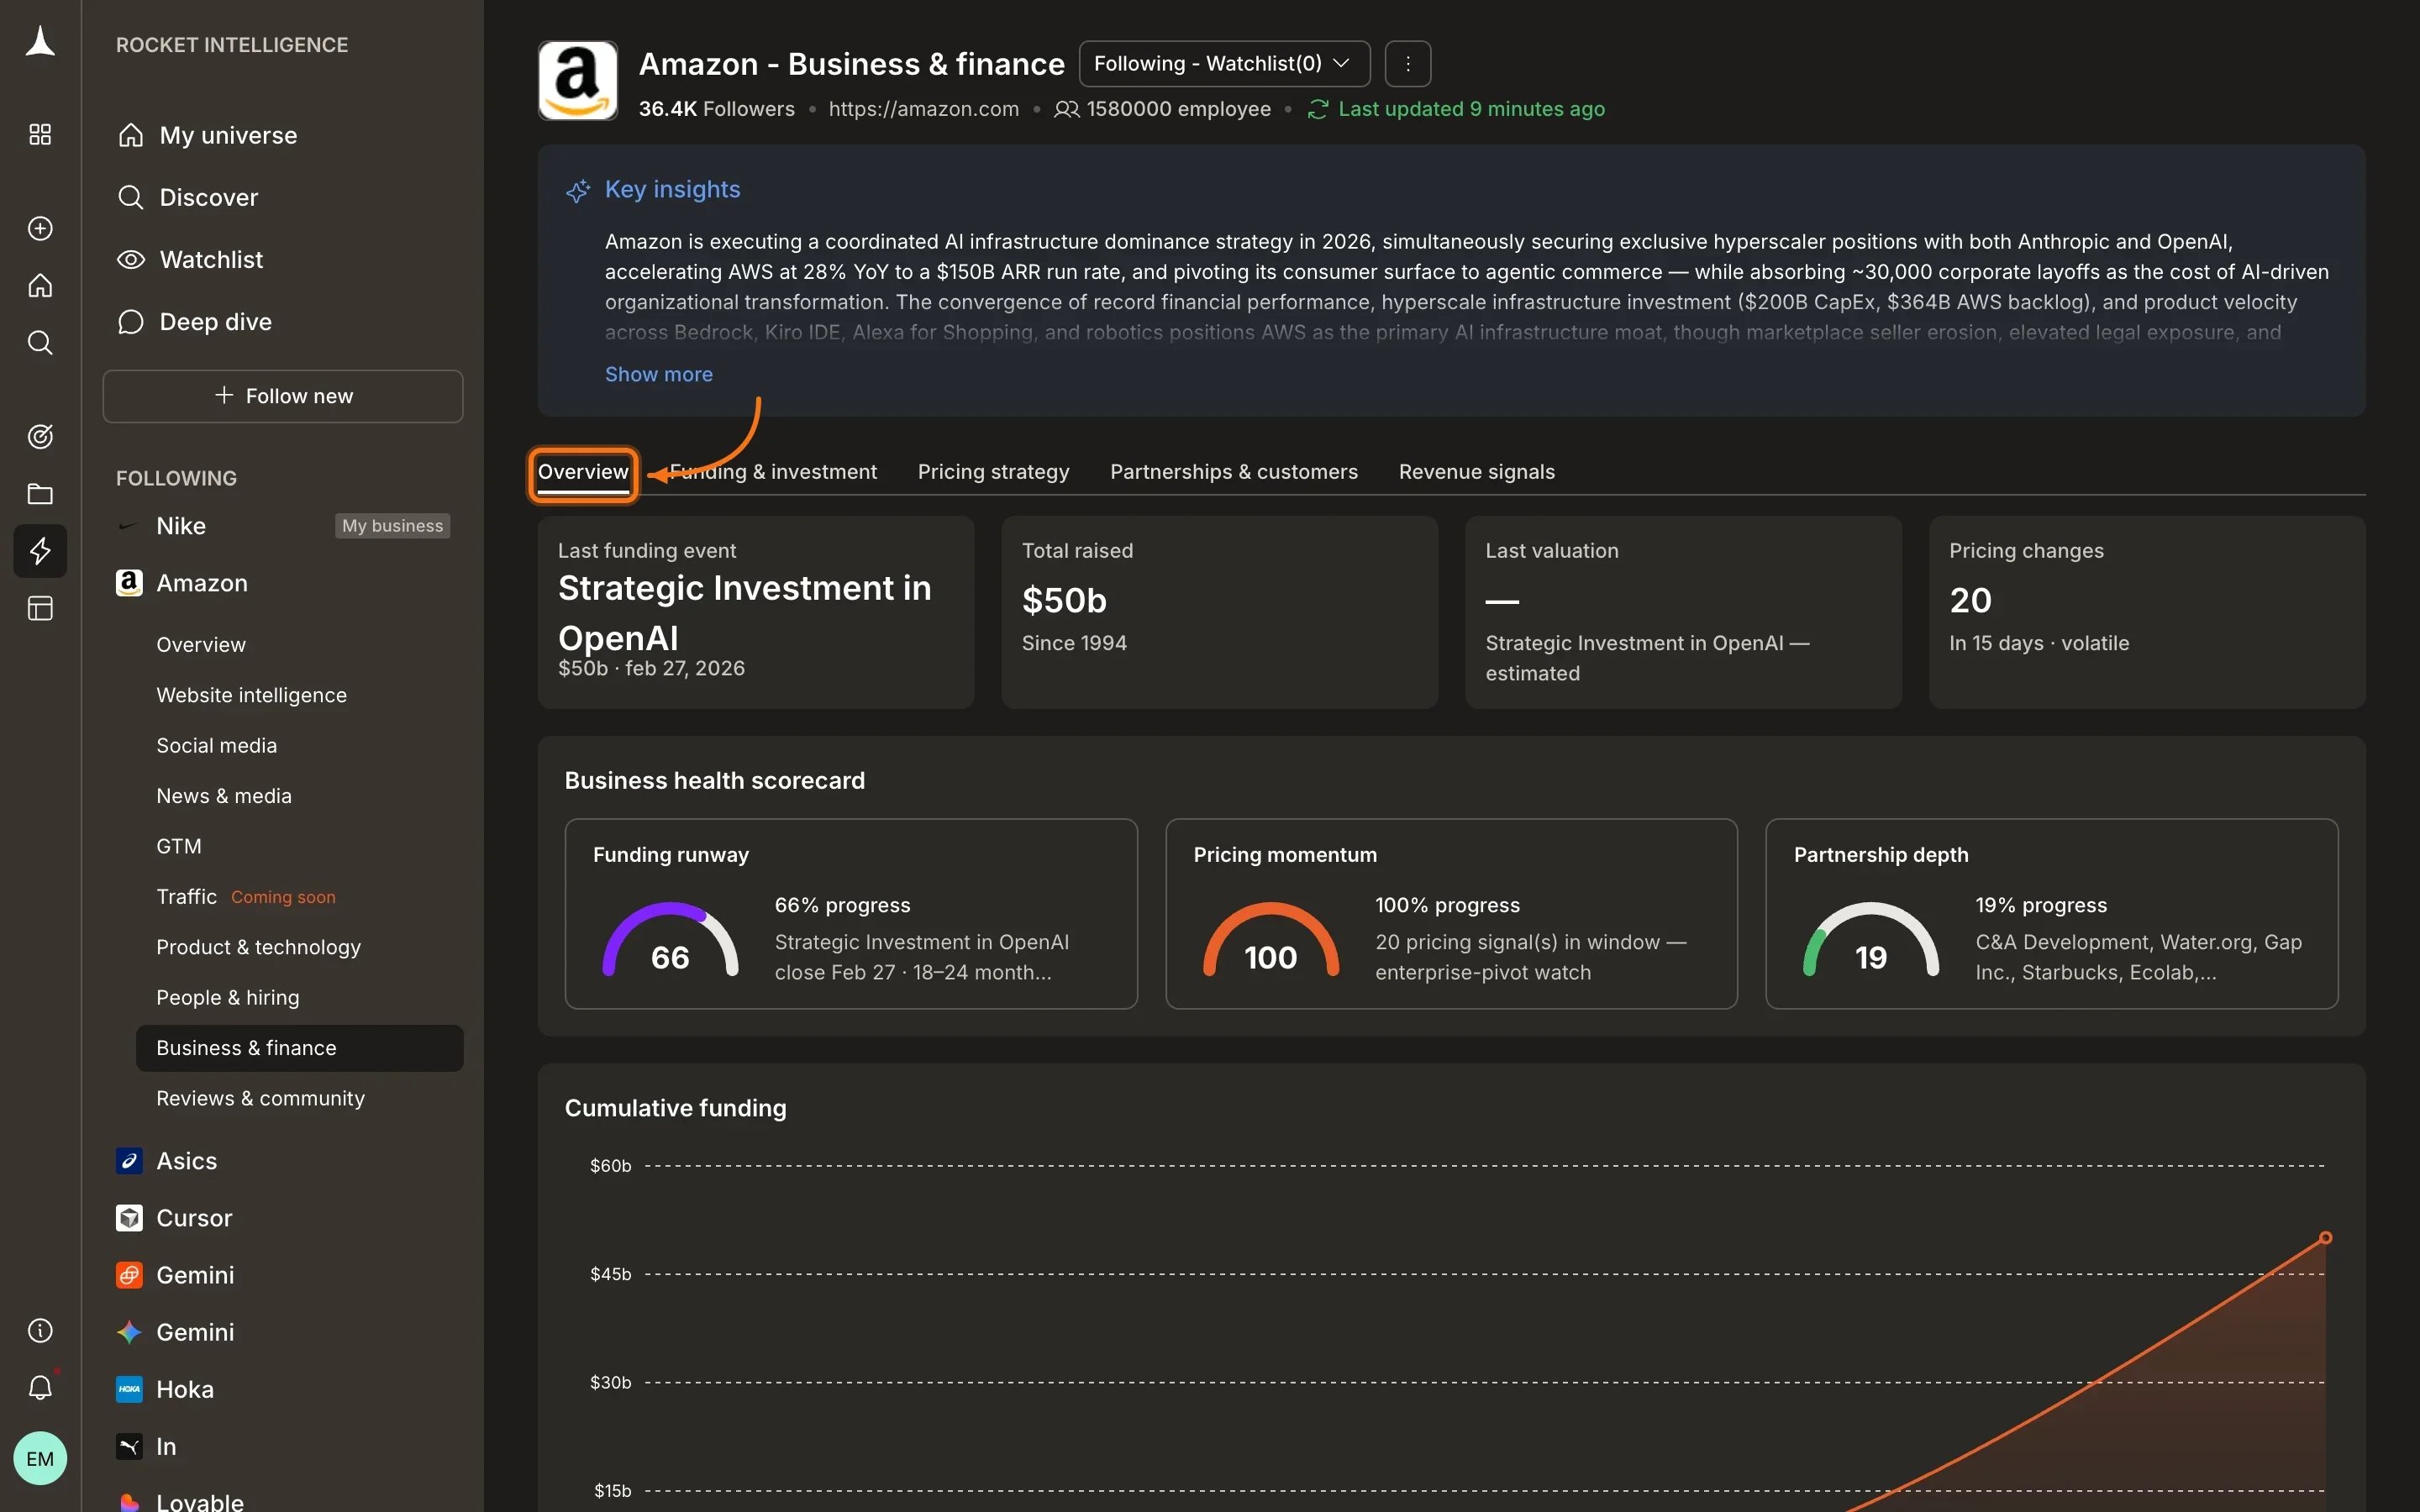
Funding & investment
Tracks funding rounds, investors, valuation changes, and capital market activity. Funding events often precede major product or GTM acceleration within 6-12 months.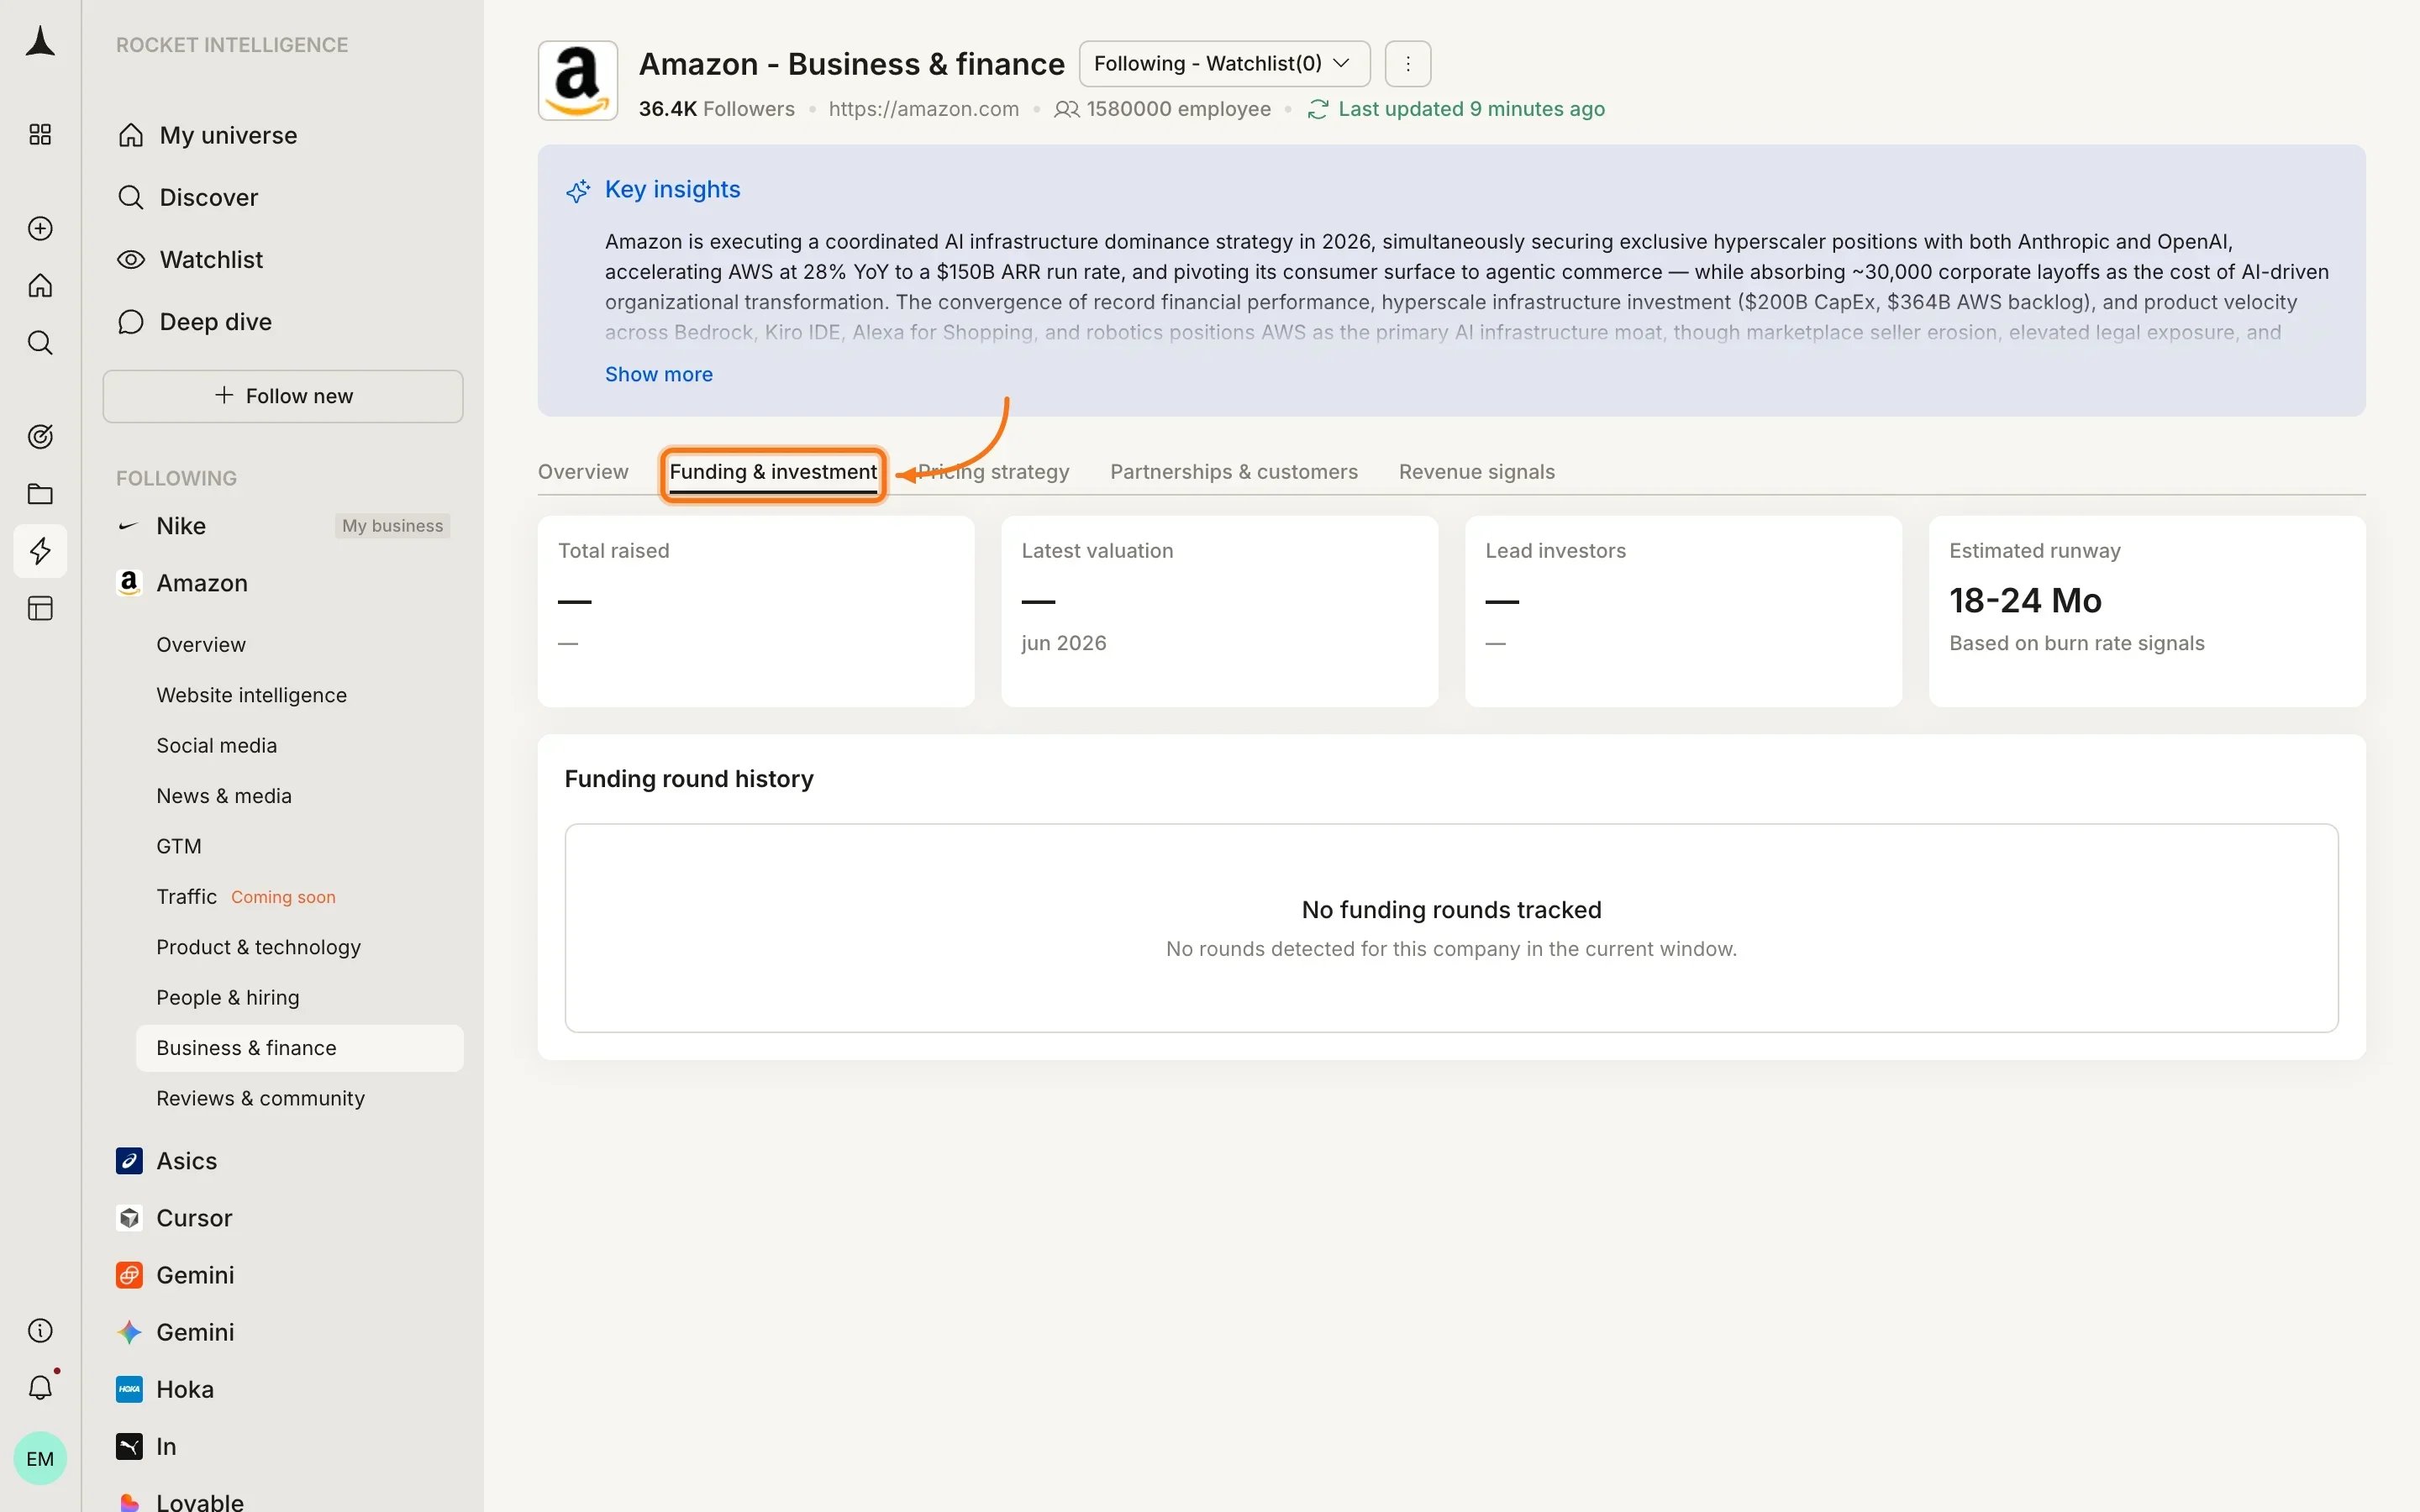
Pricing strategy
Shows pricing changes by severity, current model classification, pricing signals with dominant themes, and velocity. Displays a model classification history and pricing change history timeline with event tags like “Competitive Response” or “Market Expansion”.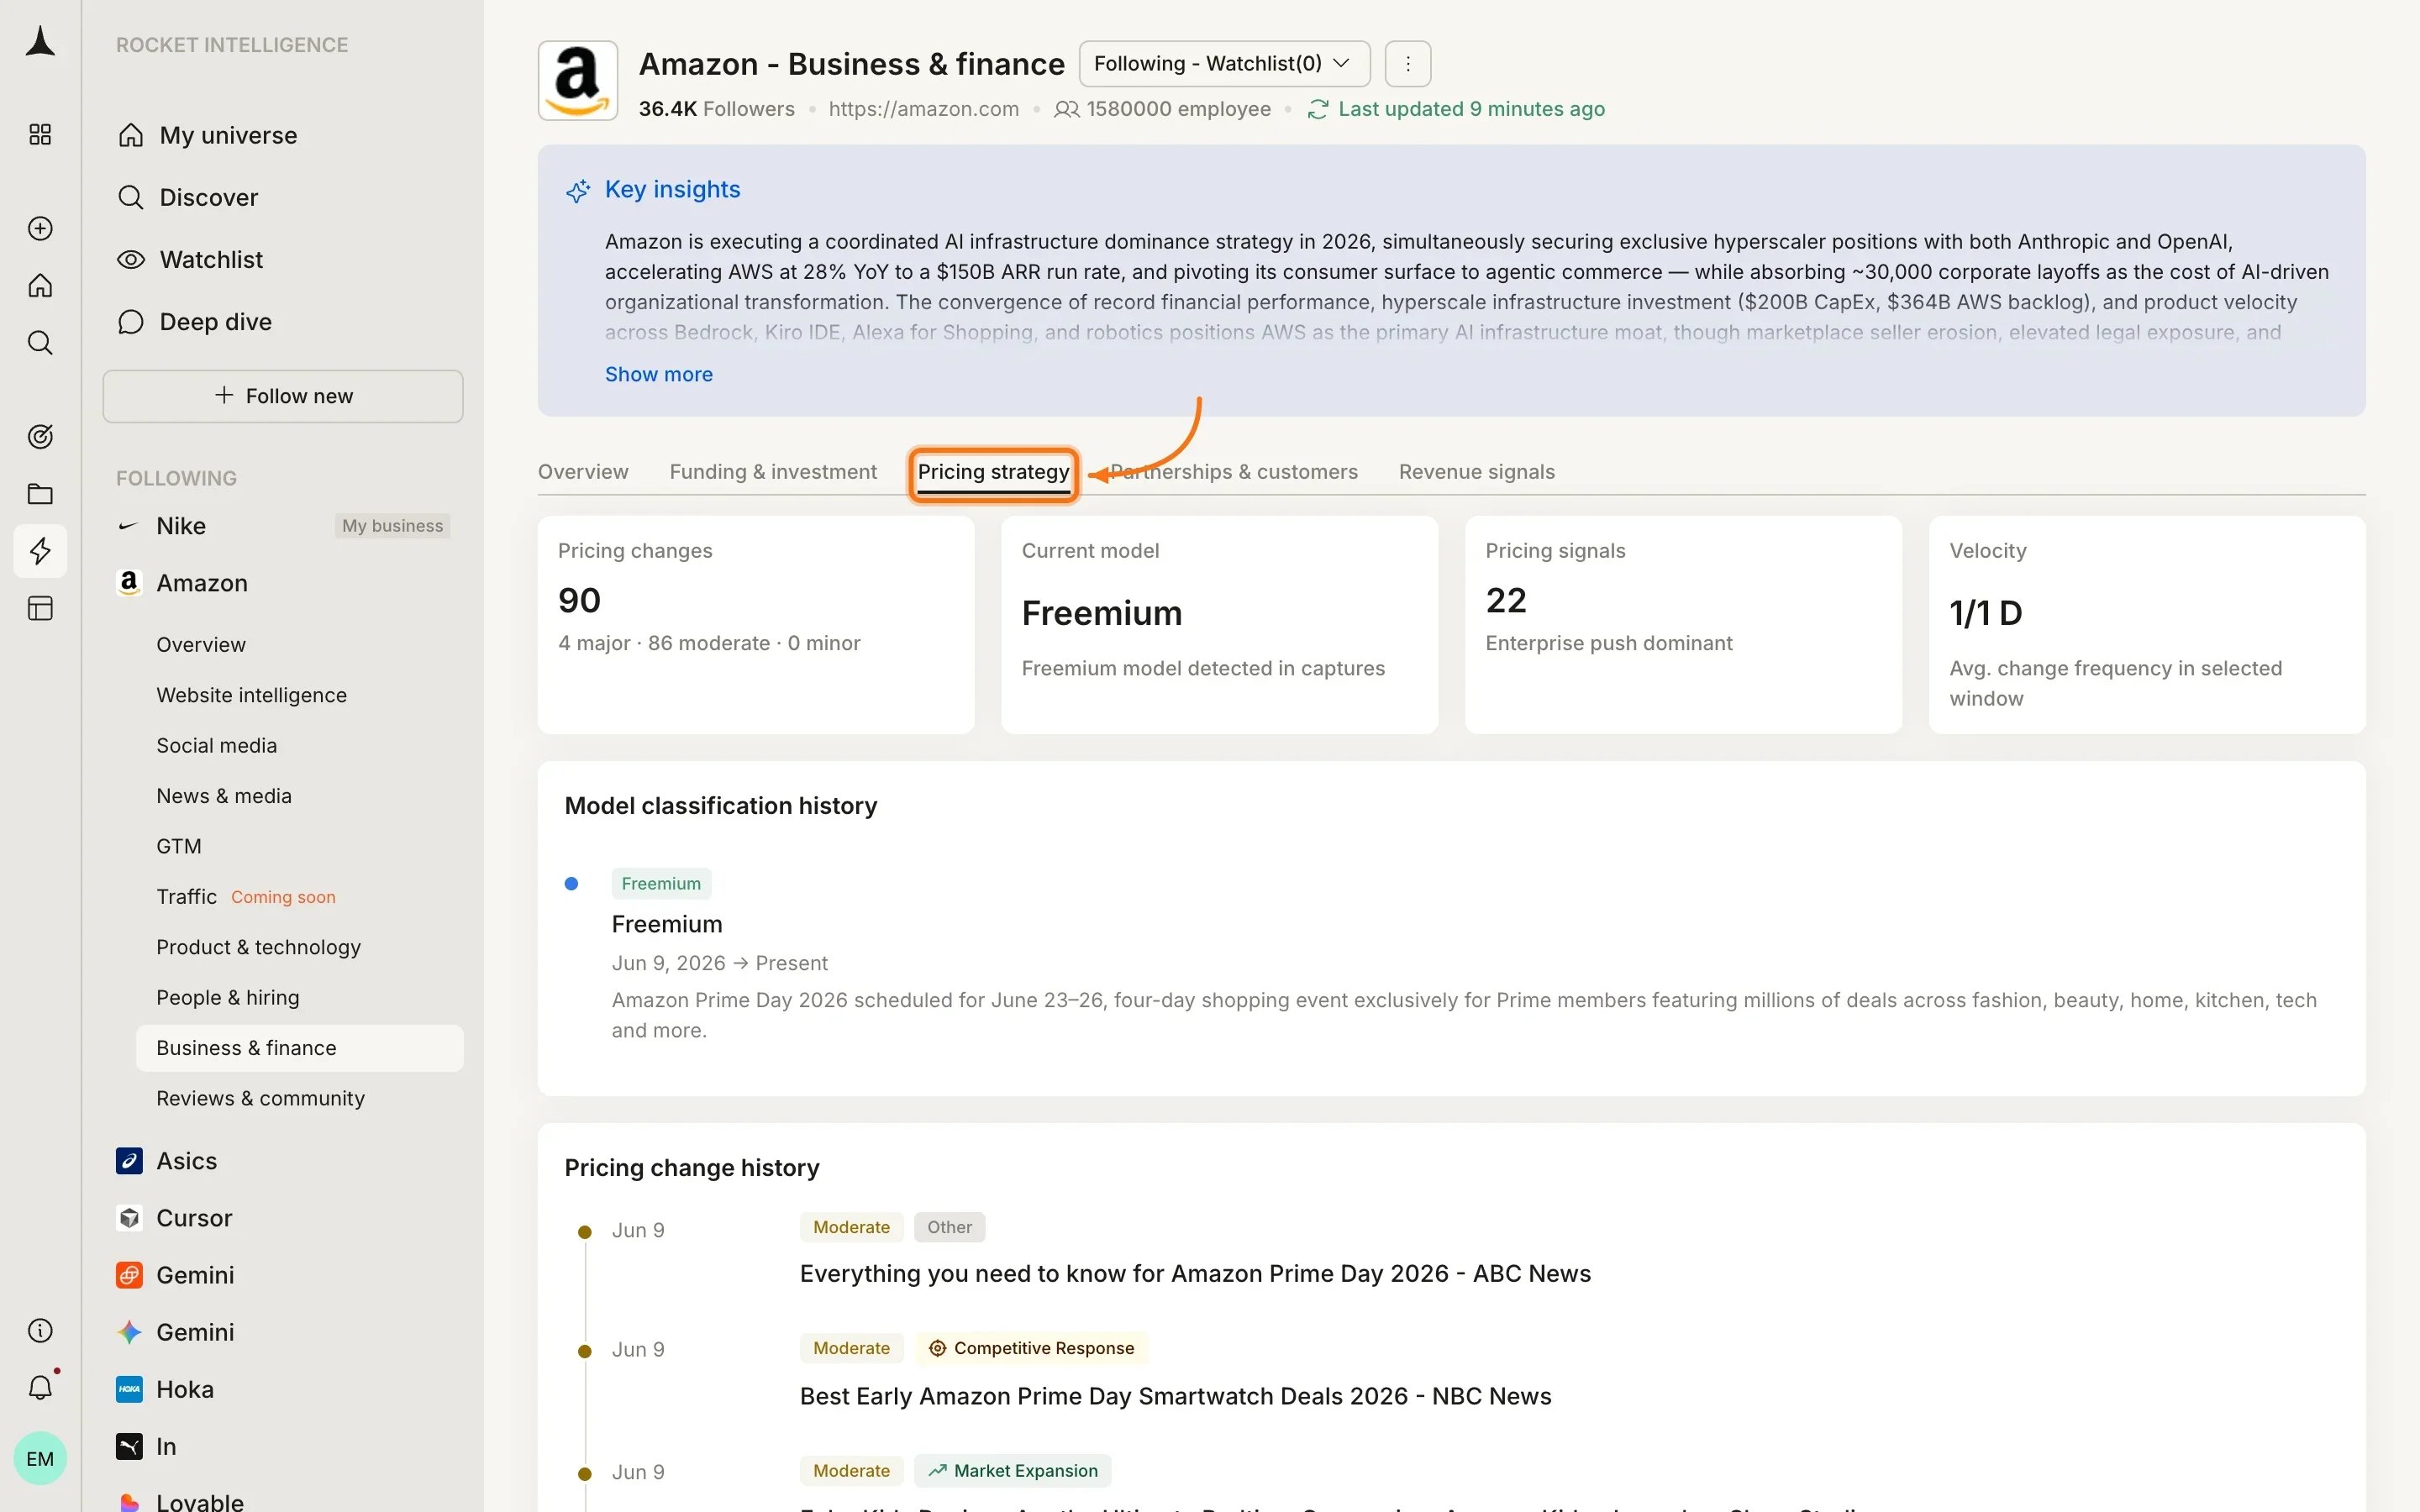
Partnerships & customers
Monitors major partnership announcements, integration partners, and customer relationships. A first co-selling partnership or a new ecosystem integration signals GTM strategy shifts.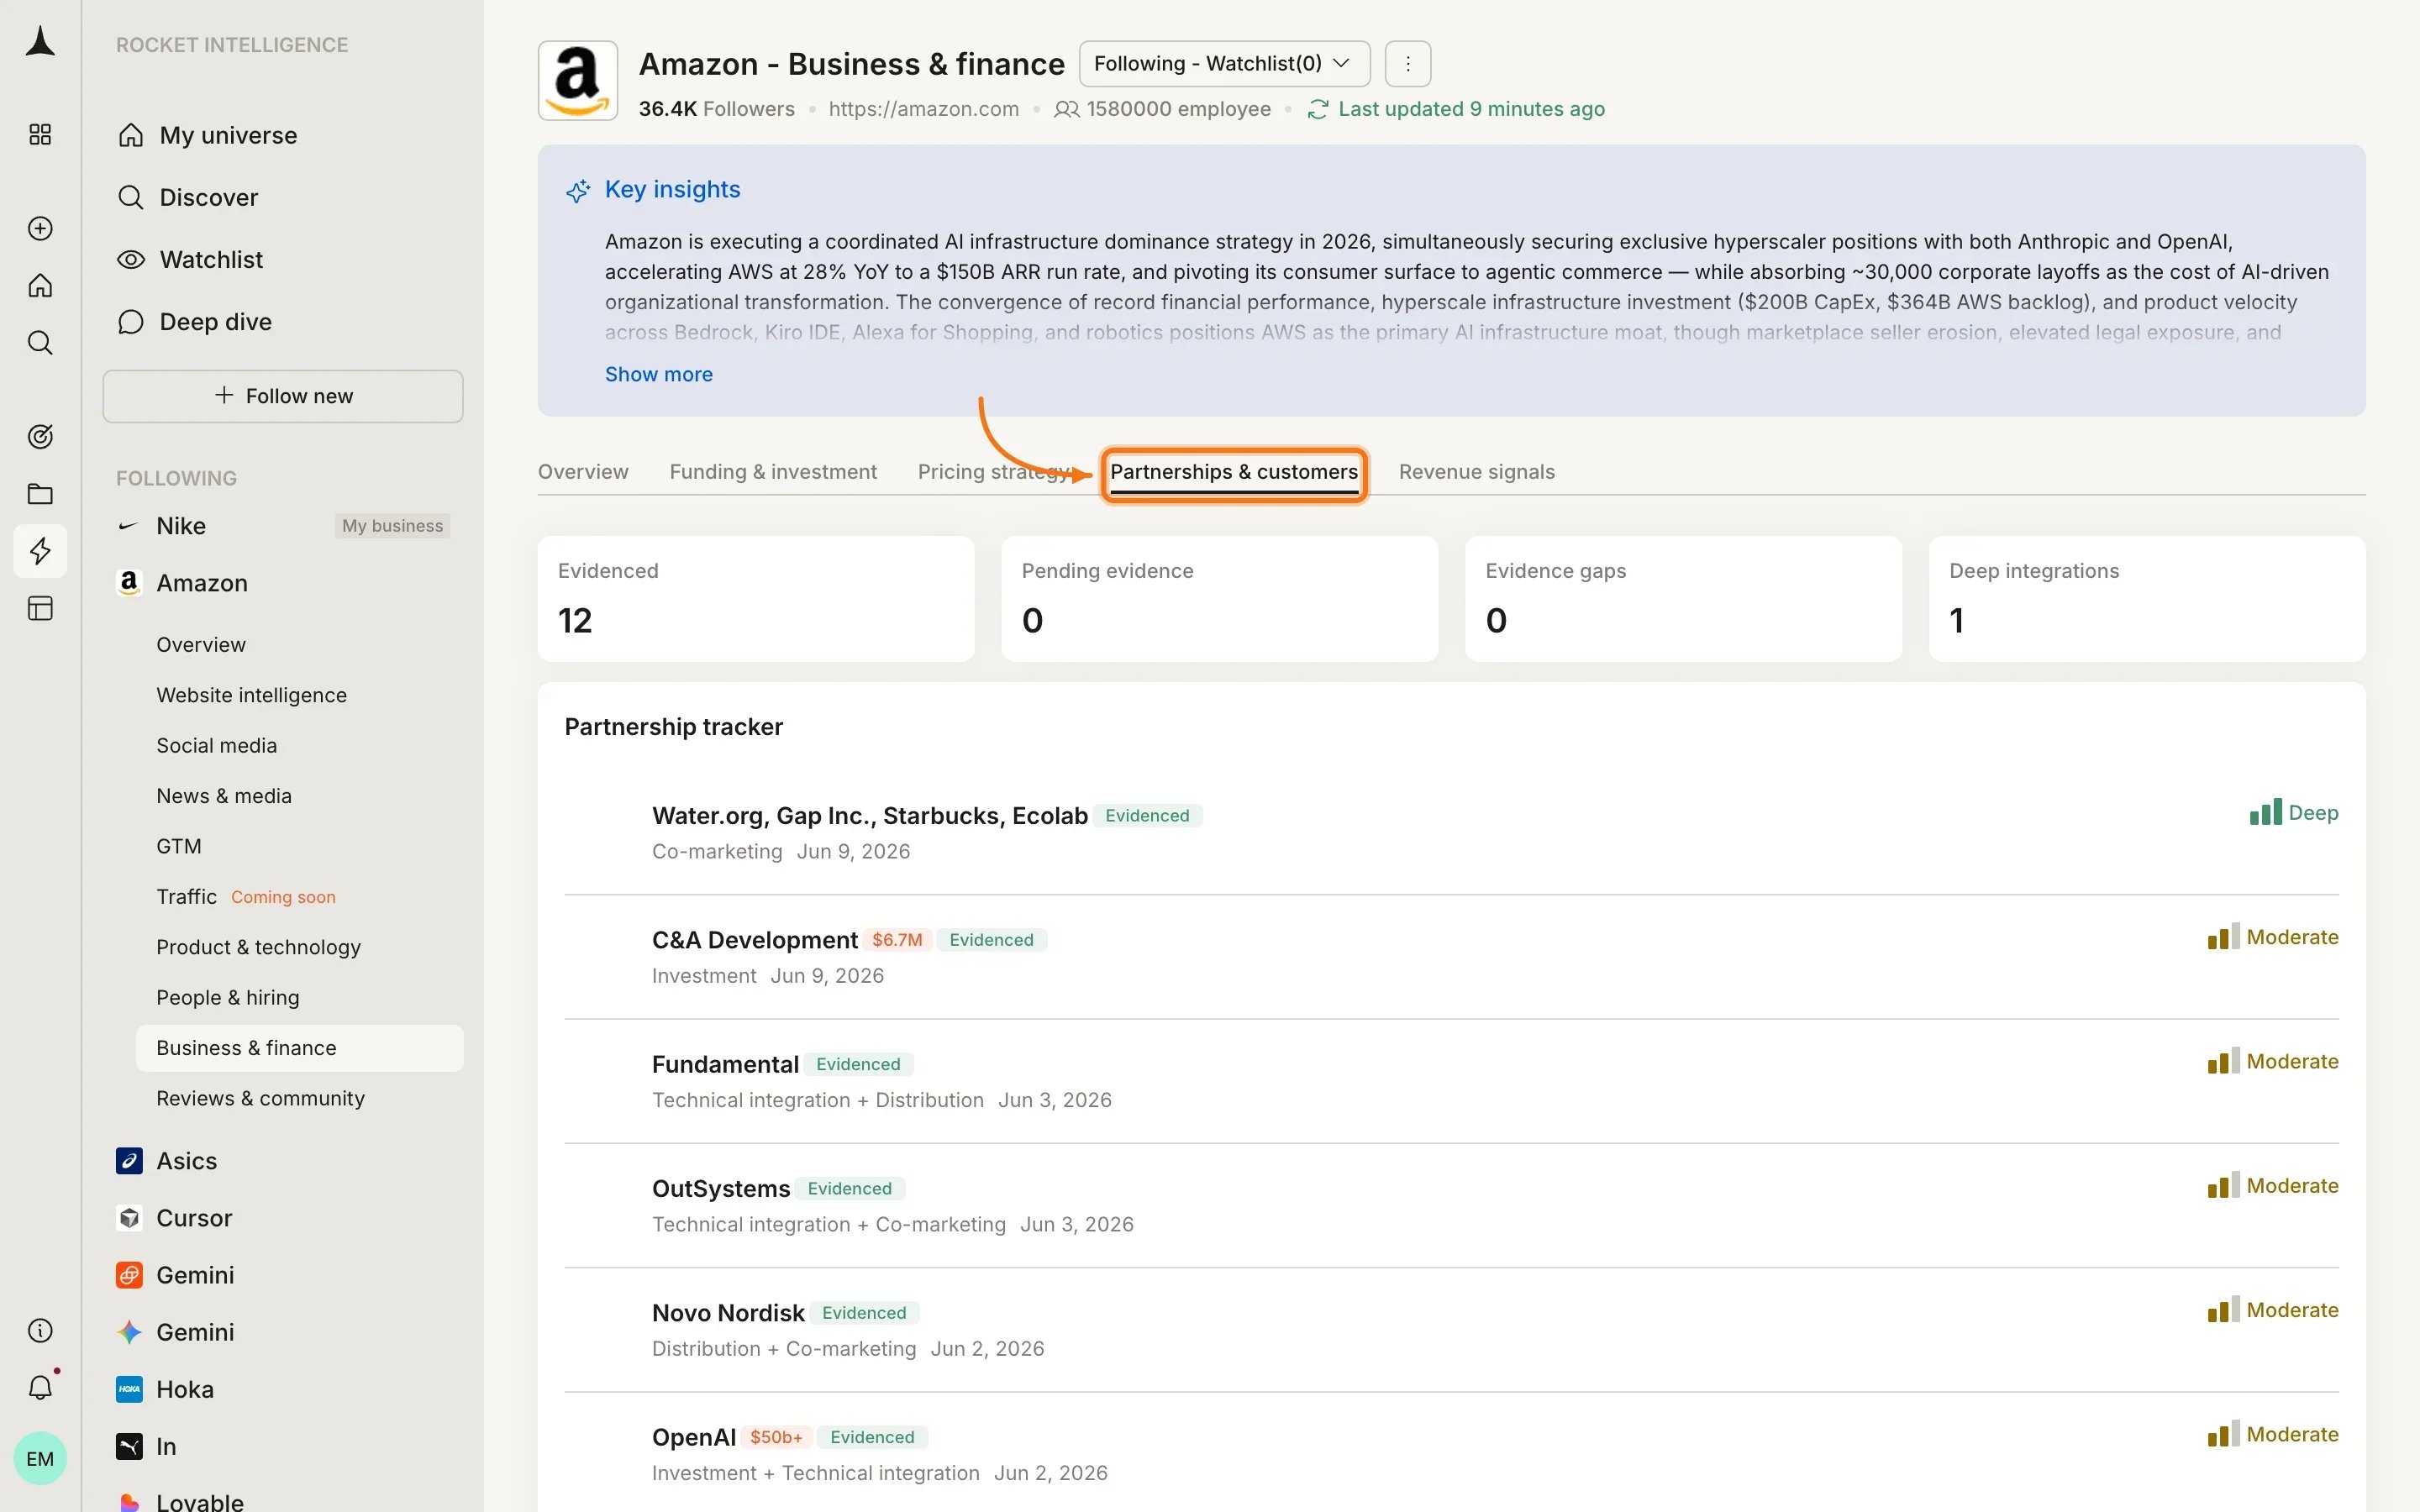
Revenue signals
Surfaces publicly inferable revenue indicators and growth metrics. Includes revenue proxy indices, funding-stage ARR benchmarks, estimated revenue range, and a revenue claims feed.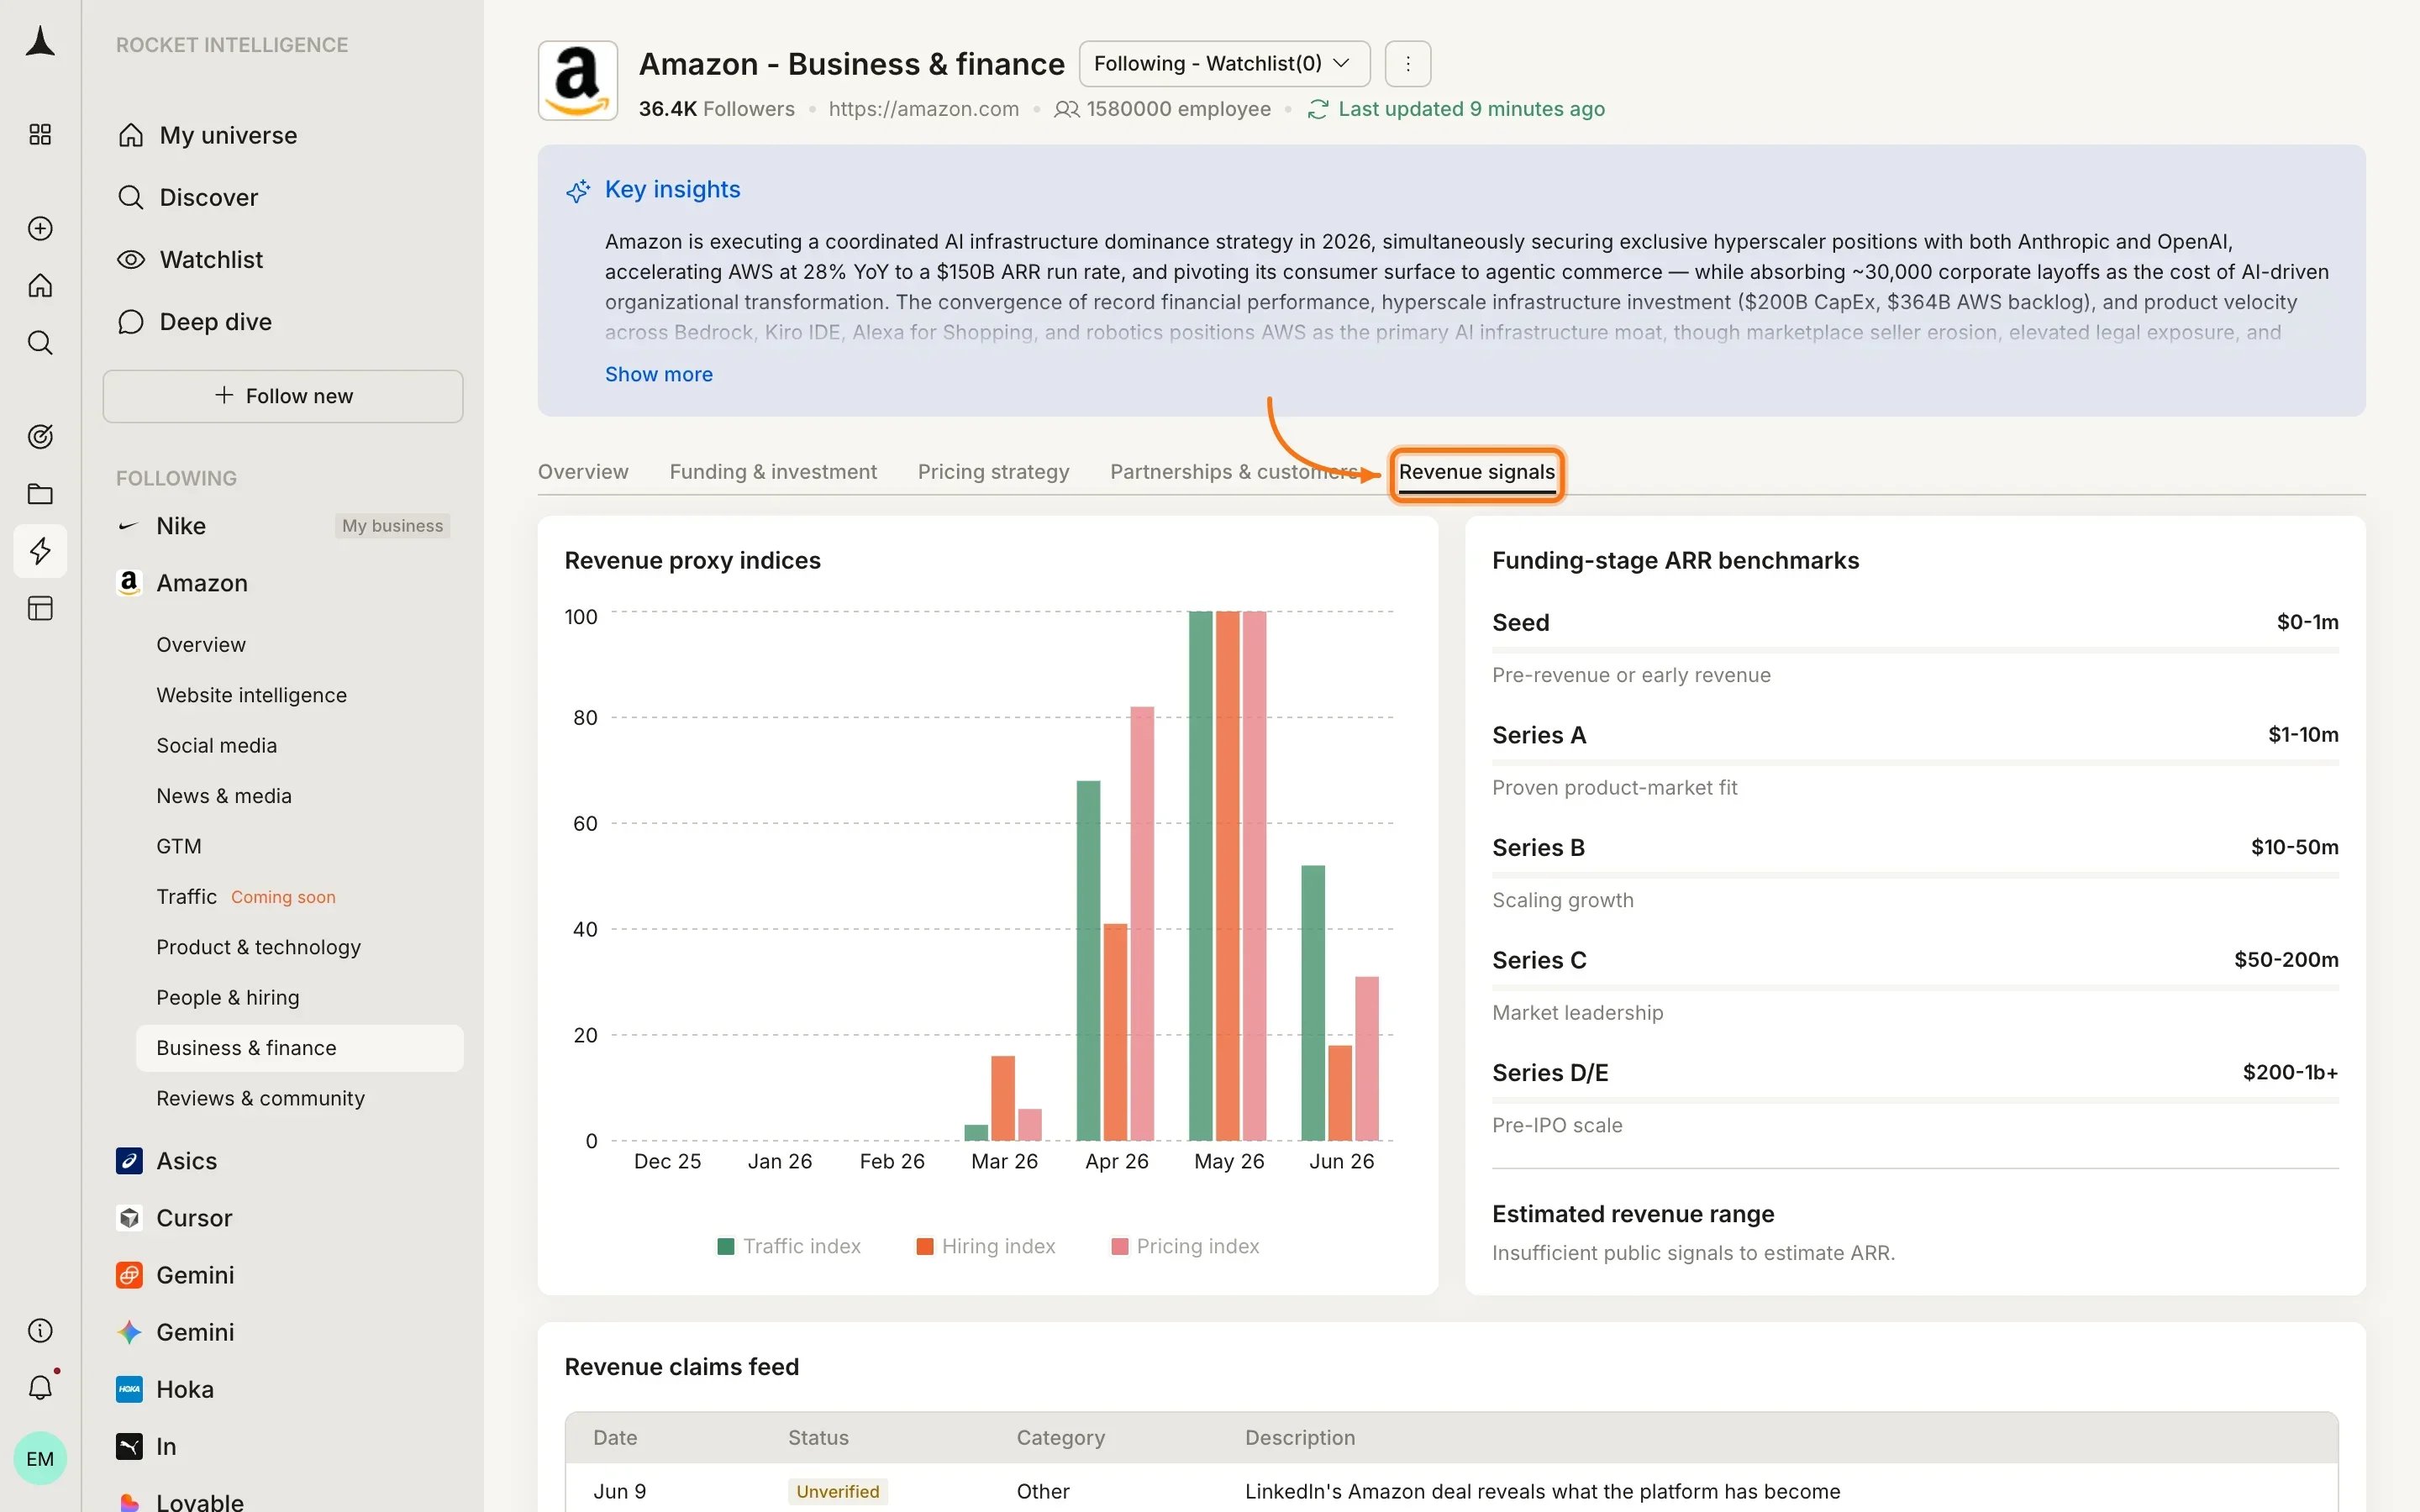
Example Intel
- Added usage-based tier on top of existing seat pricing, suggesting PLG expansion (magnitude: High)
- Series C raised at 3x previous valuation, signaling market confidence (magnitude: High)
- First major partnership announced in 12 months, indicating a break from solo GTM (magnitude: Medium)
- Removed free tier entirely, suggesting shift to sales-led or effort to reduce support burden (magnitude: Medium)
- Pricing change tagged as “Competitive Response” two weeks after a competitor’s price cut (magnitude: Low)
What is not in this pillar
| Signal type | Where to find it |
|---|---|
| Pricing page layout change (HTML/copy) | Website |
| Funding article as press coverage | News & Media |
| Revenue-related job postings | People & Hiring |
| Ad spend signals | GTM |
What’s next
Reviews & Community
What customers and the market say back.
People & Hiring
Team composition and what hiring implies about strategy.