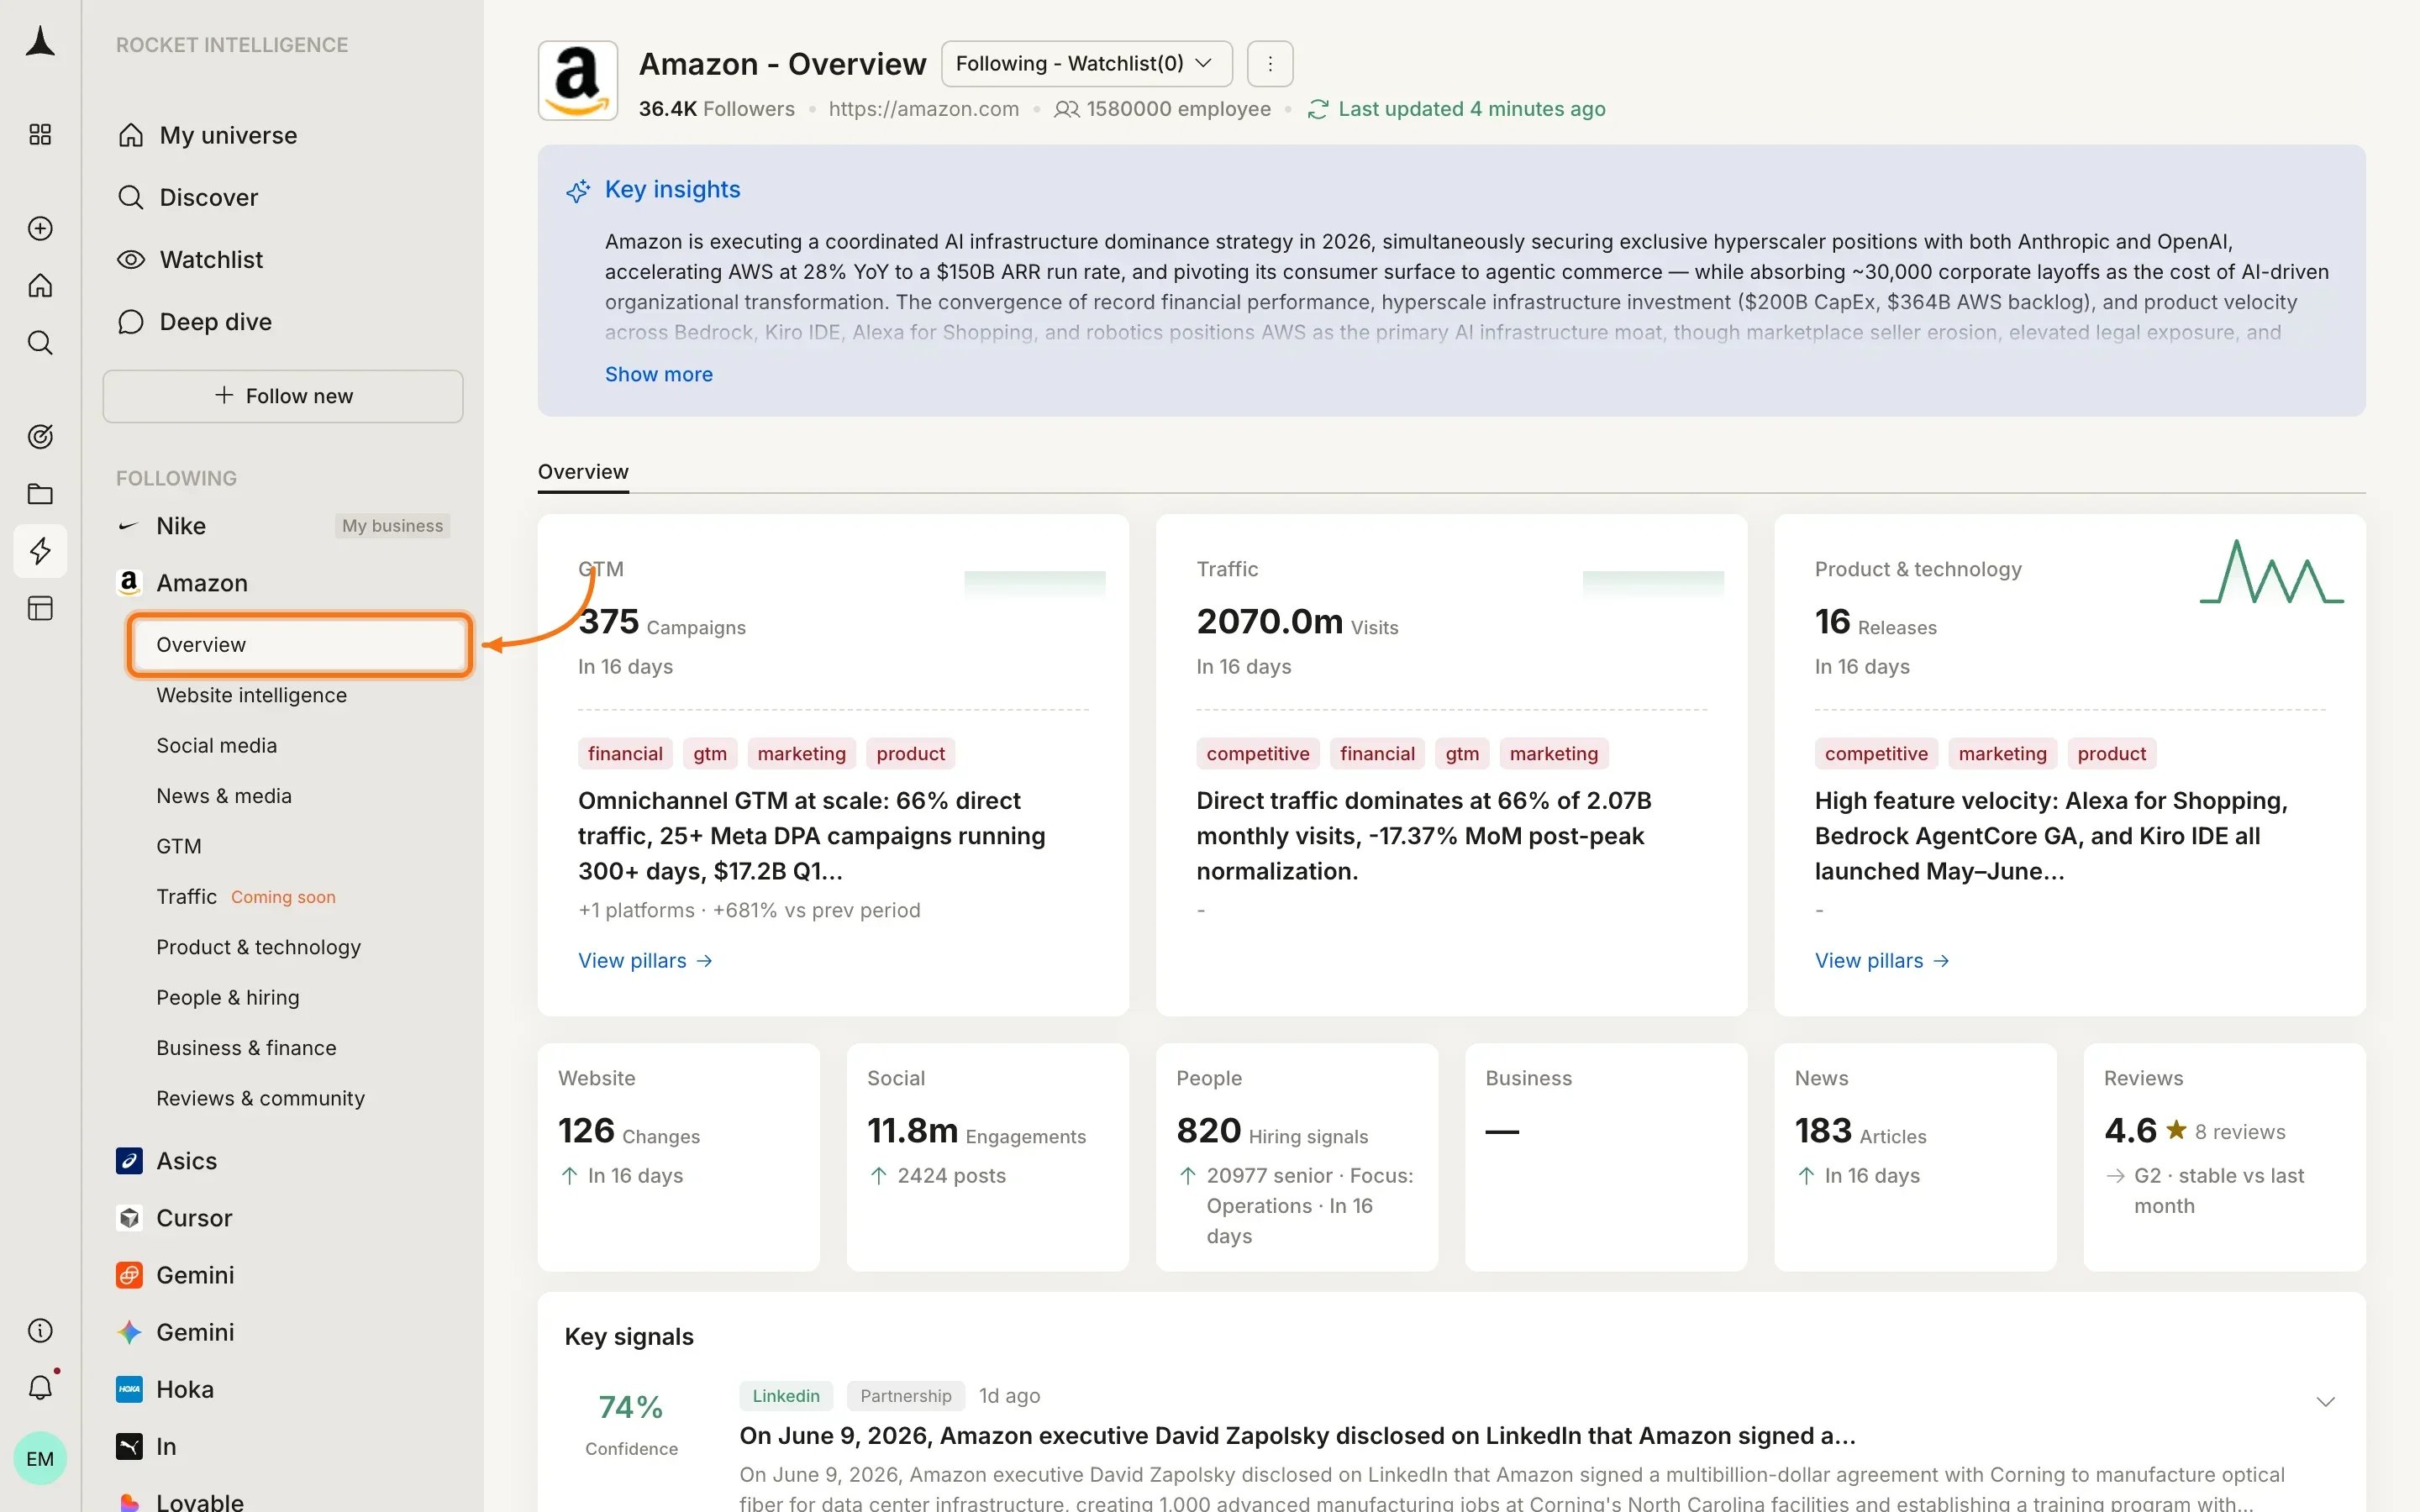
Overview tab
The Overview is not a separate data source. It is a cross-pillar summary that gives you a quick read before opening individual pillars. What you see on Overview:- Key Insights: an AI-generated summary of the most significant recent activity across all pillars
- Pillar summary cards: top-level metrics with trend graphs (e.g., GTM 375 Campaigns, Traffic 2070.0m Visits, Product & technology 16 Releases) and highlighted tags for what changed recently
- Pillar stat row: counts across every dimension at a glance: Website 126 Changes, Social 11.8m Engagements, People 820 Hiring signals, Business -, News 183 Articles, Reviews 4.6★
- Key signals: high-magnitude findings surfaced from individual pillars with confidence scores and expandable details
Sidebar navigation
When you select a company in the sidebar, it expands to show all available pillar tabs. Click any pillar name to jump directly to that dimension of the company’s activity.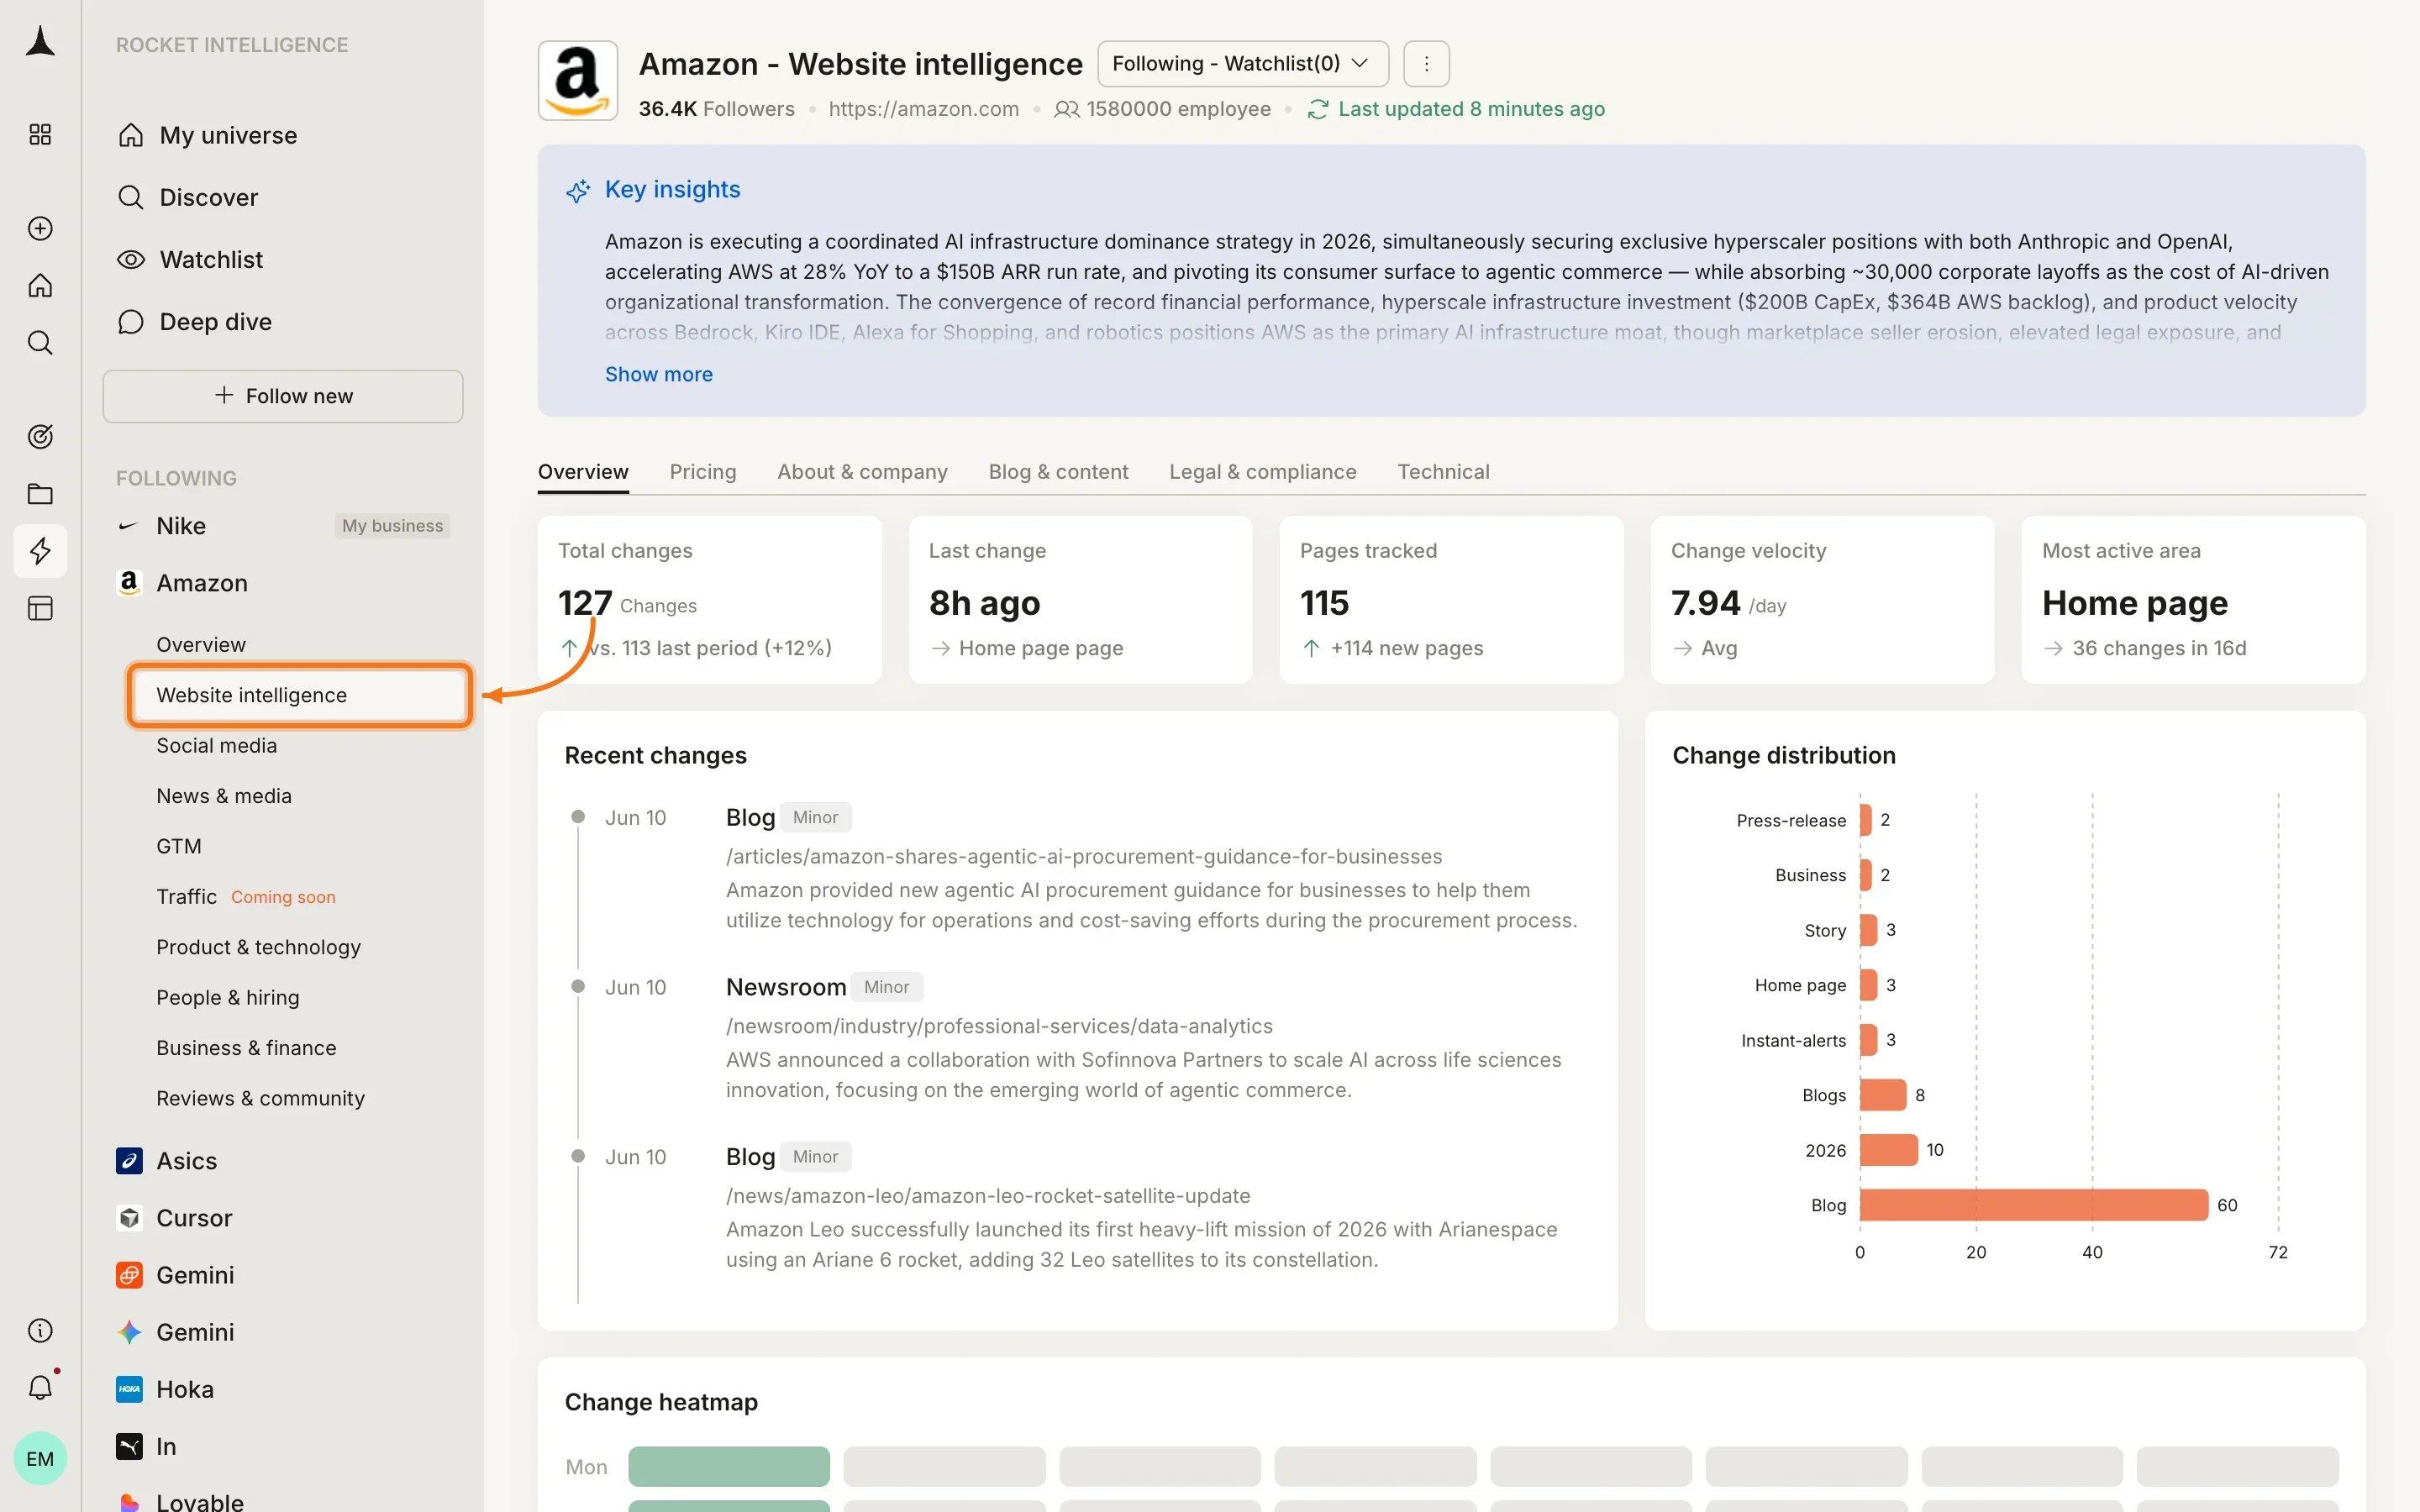
Nine pillars
Website Intelligence
What the company says on its own site
Social Media
Posts, engagement, and executive activity
News & Media
Third-party press and editorial coverage
GTM
How the company acquires customers
Traffic
Who visits and from where (Coming soon)
Product & Technology
What the company ships
People & Hiring
Who works there and what hiring implies
Business & Finance
Revenue signals, funding, and partnerships
Reviews & Community
What customers and the market say back
Pillar boundary cheat sheet
One real-world event can create signals in several pillars. Use this table to know where to look first.| If you are looking at… | Open this pillar |
|---|---|
| Homepage, pricing page, blog on their site | Website Intelligence |
| Company or executive posts on social platforms | Social Media |
| Visits, SEO rankings, channel mix | Traffic |
| Ads, campaigns, creators, DevRel | GTM |
| Releases, GitHub, API, changelog | Product & Technology |
| Jobs, exec moves, Glassdoor | People & Hiring |
| Funding, pricing strategy, partnerships | Business & Finance |
| Press, journalists, media narrative | News & Media |
| G2, Reddit, HN, app reviews | Reviews & Community |
| Everything at a glance | Overview |
Cross-pillar pattern detection
Individual pillars give depth. The real Intel often emerges from patterns that span multiple dimensions:Escalation
A signal starts in one pillar and spreads to others. For example, a blog post topic (Website) begins appearing in executive LinkedIn posts (Social), then shows up in press coverage (News). The magnitude increases as the pattern grows.Convergence
Multiple independent signals in different pillars point toward the same strategic move:- Pricing tier added (Website) + Enterprise sales hiring (People) + Security certification page (Website) + First CIO-targeted ads (GTM) = enterprise expansion
Divergence
What a company says about itself contradicts what the market says back:- Messaging claims “fastest-growing” (Website) but review sentiment is declining (Reviews) and coverage tone turned negative (News) = narrative gap worth investigating
- Launch detection: Website changes + Social posts + News coverage spiking in the same window
- Strategic pivot: Messaging shift (Website) + New department hiring (People) + Ad theme change (GTM)
- Trouble signals: Review ratings dropping (Reviews) + Hiring freeze (People) + Media tone shifting negative (News)
What’s next
Website Intelligence
Start with the most direct window into a company’s strategy.
Best practices
How to read pillars effectively and spot patterns.